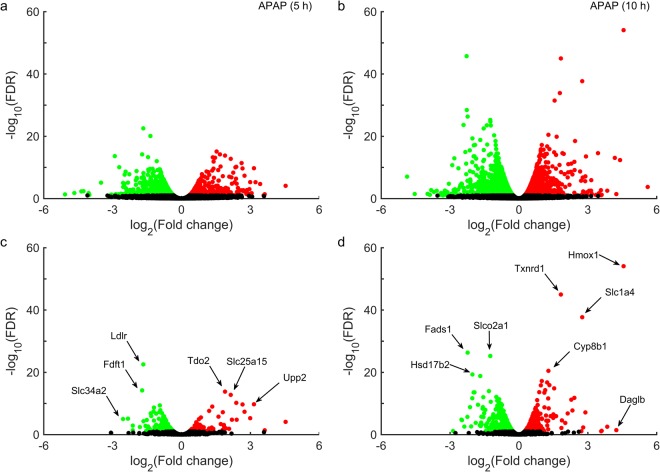
Figure 2.
Volcano plots of differentially expressed genes (DEGs) in the liver, induced by acetaminophen (APAP). False discovery rates (FDRs) plotted against APAP-induced log2 fold changes in DEGs for one group of rats collected at 5 h (a) and a second group at 10 h (b). Genes from the RNA-seq data mapped onto the iRno model at 5 h (c) and 10 h (d). Circles in red/green show genes/transcripts that were significantly up-/down-regulated (FDR < 0.10), whereas black circles show those that were unchanged. Cyp8b1: Cytochrome P450 family 8 subfamily B member 1; Daglb: Diacylglycerol lipase, beta; Fads1: Fatty acid desaturase 1; Fdft1: Farnesyl diphosphate farnesyl transferase 1; Hmox1: Heme oxygenase 1; Hsd17b2: Hydroxysteroid (17-beta) dehydrogenase 2; Ldlr: Low density lipoprotein receptor; Slco2a1: Solute carrier organic anion transporter family, member 2a1; Slc1a4: Solute carrier family 1 member 4; Slc25a15: Solute carrier family 25 member 15; Slc34a2: Solute carrier family 34 member 2; Tdo2: Tryptophan 2,3-dioxygenase; Tnxrd1: Thioredoxin reductase1; Upp2: Uridine phosphorylase 2.

