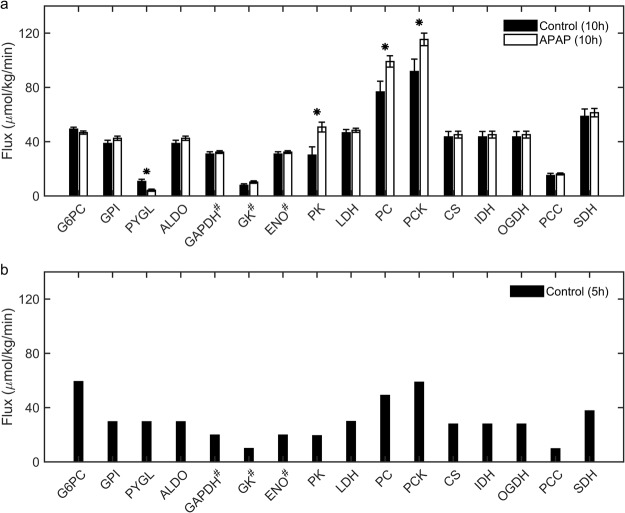
Figure 4.
Acetaminophen (APAP)-induced absolute flux measurements in the glucose production pathway obtained from the tracer dilution study under fasting conditions. (a) Bar graphs of flux measurements calculated from metabolic flux analysis 10 h after treatment with APAP (unfilled bars) or vehicle (filled bars). (b) Bar graph of approximate absolute flux values derived from the literature for control rats studied after 5 h of fasting31–33 (*p < 0.05, #values in Hexose units and abbreviations as in Fig. 3).

