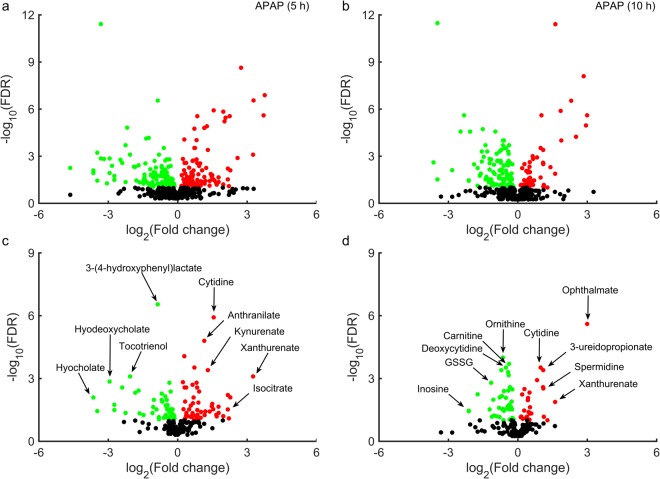
Figure 5.
Volcano plots of global plasma metabolite changes induced by acetaminophen (APAP). False discovery rates (FDRs) plotted against APAP-induced log2 fold changes in plasma metabolites for one group of rats collected at 5 h (a) and a second group at 10 h (b). Metabolites mapped onto the iRno model based on KEGG ID annotation at 5 h (c) and 10 h (d). Red/green circles show metabolites significantly elevated/depressed (FDR < 0.10) for 5 and 10 h post APAP treatment, respectively; symbols in black show unchanged metabolites.

