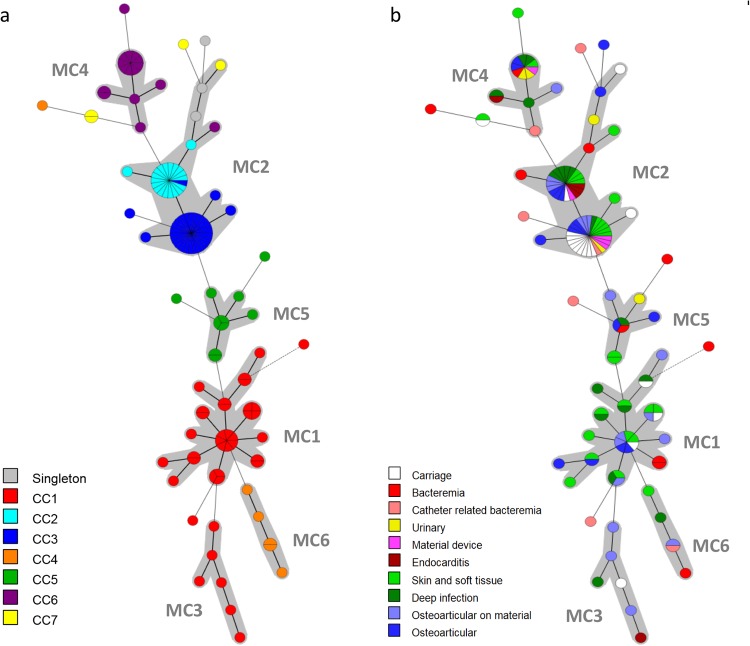
Figure 3.
Minimum spanning tree of the 128 S. lugdunensis isolates typed by multiple-locus VNTR analysis (MLVA). The MLVA data were analyzed in BioNumerics. Clustering of MLVA profiles was done using a categorical coefficient. The colors used are based (a) on clonal complexes (CCs) defined by MLST and (b) on clinical contexts. Each circle represents an MLVA type. Thick, short lines connecting two types denote types differing in a single locus; thin, longer lines connect double-locus variants; and dashed lines indicate the most likely connection between two types differing in more than two loci. Gray zones around circles delineate MLVA complexes (MCs). MCs are also indicated in characters e.g. MC1 denotes MLVA complex 1.

