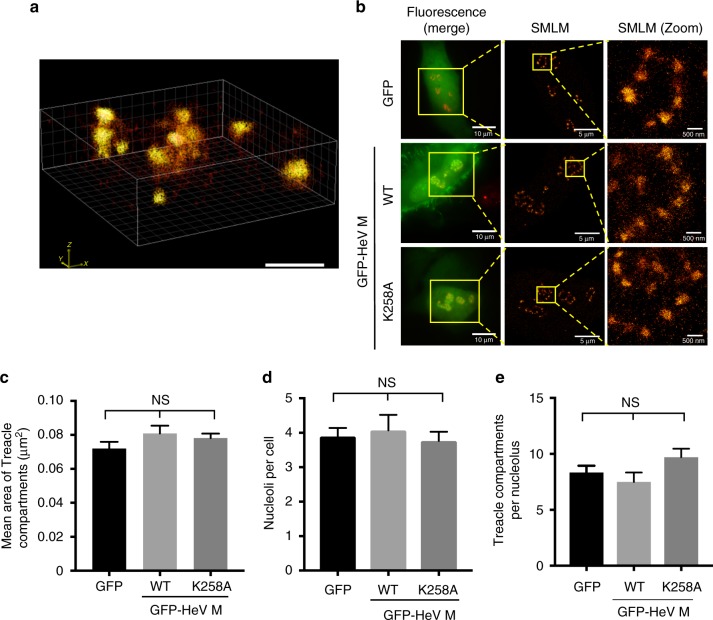
Fig. 5.
HeV M protein expression does not impact the structure or distribution of Treacle-enriched compartments. HeLa cells expressing GFP alone (a) or the indicated proteins (b) were fixed and immunolabeled for Treacle before analysis. a dSTORM single molecule localization microscopy (SMLM) was used to generate 3D images of Treacle-enriched subnucleolar compartments. Scale bar indicates 1 μm. b Fluorescence microscopy was used to identify cells expressing GFP (green) and immunostained for Treacle (red/yellow in merged image), which were then analyzed by SMLM to detect Treacle. Scale bars correspond to the indicated sizes. c–e Images such as those shown in Fig. 5b were used to determine (c) the area of Treacle-enriched compartments (mean ± s.e.m., n ≥ 427 compartments), (d) the number of nucleoli per cell (mean ± s.e.m., n ≥ 14 cells), (e) the number of Treacle-enriched compartments per nucleolus (mean ± s.e.m., n ≥ 57 nucleoli). Statistical analysis used Student’s t-test; NS not significant

