Fig. 8.
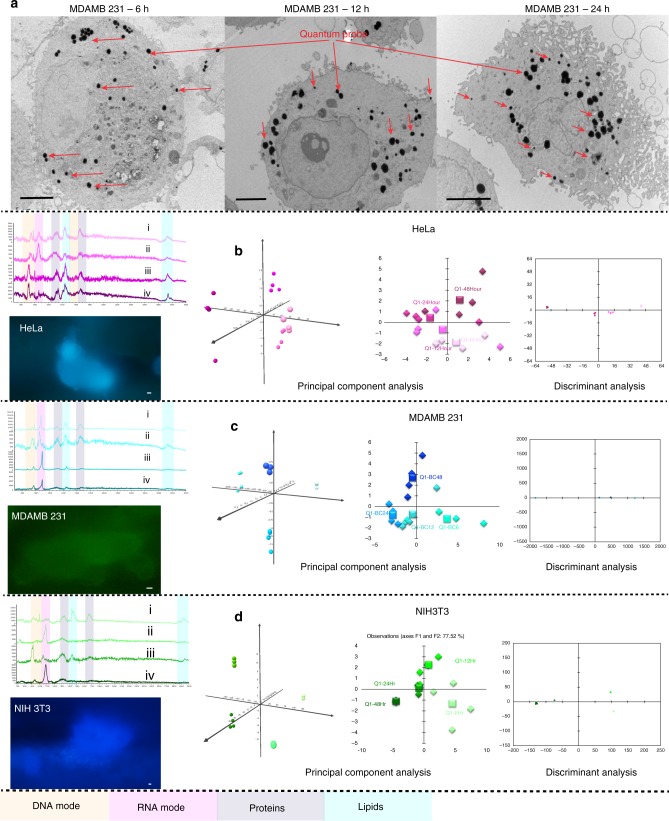
Time-based study of cancer and non-cancer cells using multivariate analysis. a TEM images of cells showing cellular uptake and internalization of the quantum probe. Internalization was time dependent. Scale bar = 5 µm. Scale bar for fluorescence images 20 µm. 6 h (i), 12 h (ii), 24 h (iii), and 48 h (iv) SERS spectra in b, c, d. The “x” axis of the spectra display Raman shift (cm−1) and “y” axis displays arbitrary units. Time-dependent PCA and DA of HeLa (b), MDAMB231 (c), and NIH3T3 (d). PCA displays 3D plot of principal components F1 on “x” axis F2 on “y” axis and F3 on “z” axis as well as 2D plot of F1 on “x” axis and F2 on “y” axis. Clear clustering and separation of centroids is evident. DA displays discriminant components F1 on “x” axis and F2 on “y” axis. Various biomolecular modes show sinusoidal enhancement trends at 12h and 24 h. The intensity increased at 48 h. This may be due to the increase in the quantity of the probe within the cells

