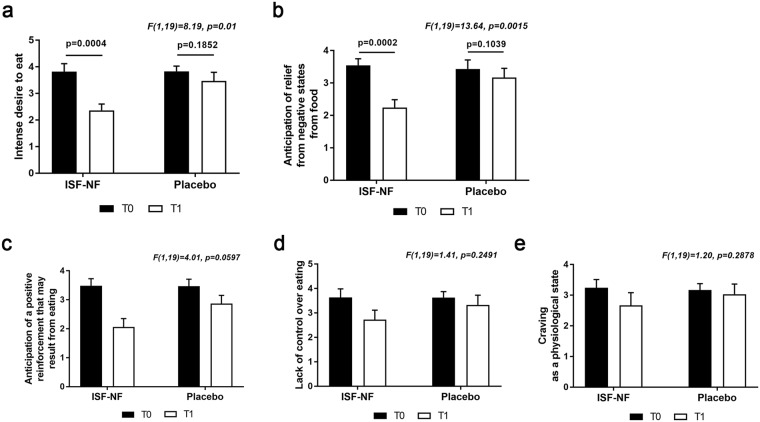
Figure 3.
A repeated measures ANOVA reveals significant main effects for two of the five FCQ-S subscales, a) intense desire to eat, F(1,19) = 23, p = 0.01 and b) F(1,19) = 13.6, p = 0.0015. Paired t-test shows that there is a significant decrease in the ISF-NF group post-treatment (T1) compared to pre-treatment (T0) for the intense desire to eat subscale, p = 0.0004 (a) and the anticipation of relief from negative states from food subscale, p = 0.0002 (b).

