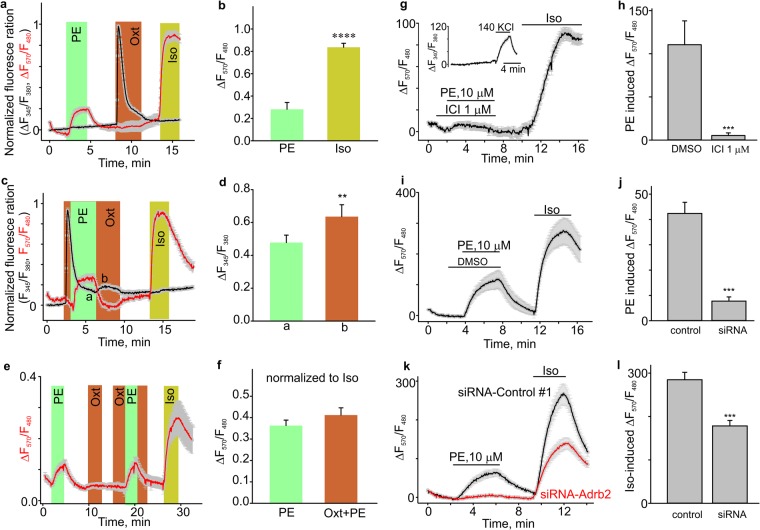
Figure 4.
Phenylephrine stimulated the intracellular increase of cAMP levels in isolated mouse uterus smooth muscle cells. (a–d) The time courses show the changes of Fura-2 fluorescence ratio (F345/F380, black line) and cAMP reporter fluorescence intensity ratio (F570/F480, red line) on isolated mouse uterus smooth muscle cells transduced with the cAMP reporter construct. (b,d) Show the summary data from (a, n = 136) and (b, n = 216). The fluorescence values were normalized to the baseline fluorescence level. To detect intracellular cAMP change, the Red Upward cADDis cAMP sensor was excited at 570 nm, whereas Green Downward cADDis cAMP sensor fluorescence was excited at 480 nm. Bars indicate the times when the applications of compounds took place. The data set is obtained from three to six repeats of independent experiments performed on different days. (e) The time course shows the cAMP reporter fluorescence intensity ratio (red line) changes in isolated mouse uterus smooth muscle cells infected with the cAMP reporter construct. (f) Summary for the data shown in (e, n = 28). The data set is obtained from four independent experiments. (g–i) The time courses and summary data show that ICI118551 (n = 77), but not the vehicle DMSO (n = 51) prevents the PE-induced changes of cAMP reporter fluorescence intensity ratio (F570/F480) in isolated mouse uterine smooth muscle cells transduced with the cAMP reporter construct. The inset in (g) shows the time course of KCl-induced ΔF340/F380 ratio changes (black line). (j–l) The siRNA against the β2-adrenoceptor, but not the Negative Control #1 siRNA, prevented phenylephrine-induced cAMP rises in mouse uterine smooth muscle cells. (k) Shows the time courses for PE- and Iso-induced changes in cAMP levels in mouse uterine smooth muscle cells electroporated with the indicated siRNAs. PE failed to stimulate cAMP rises in mouse uterine smooth muscle cells electroporated with siRNA against the β2-adrenoceptor (n = 101), but induced cAMP rises in mouse uterine smooth muscle cells electroporated with Negative Control #1 siRNA (n = 91). PE, phenylephrine; Oxt, oxytocin; Iso, isoproterenol. **p < 0.01, ****p < 0.0001. The data were presented as means ± S.E. The grey vertical lines represent S.E. The “n” values indicate the number of cells, and each data set is obtained from three experiments.

