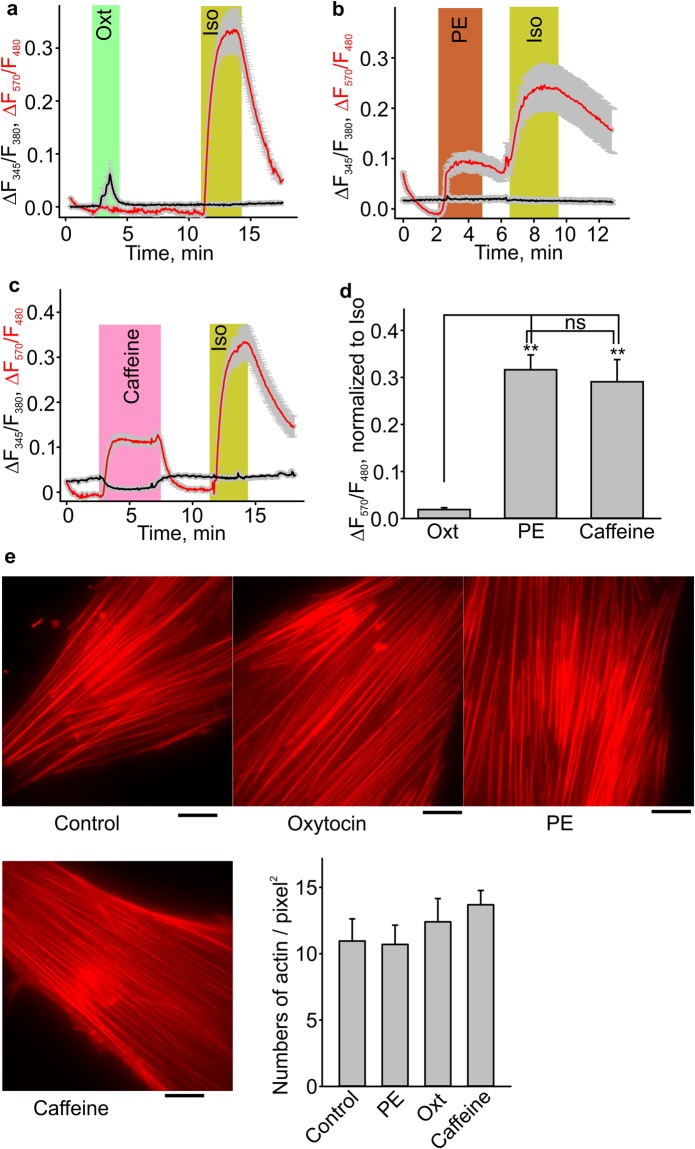
Figure 7.
Phenylephrine (PE) and caffeine increased intracellular cAMP levels in HUSMCs. (a–d) Sample traces and summary data for phenylephrine (PE, n = 43), oxytocin (Oxt, n = 40), caffeine (n = 28) and isoproterenol (Iso)-induced cAMP reporter fluorescence ratio changes in HUSMCs. (e) F-actin stress fiber organization visualized with phalloidin-FITC in HUSMCs from control (n = 7), PE (n = 7), oxytocin (n = 6) and caffeine (n = 6) treated groups (scale bar indicates 20 µm). The right panel shows the summary data. **p < 0.01. The data were presented as means ± S.E. The grey vertical lines represent S.E. The “n” values indicate the number of cells. Each data set is obtained from three to five repeats of independent experiments performed on different days.

