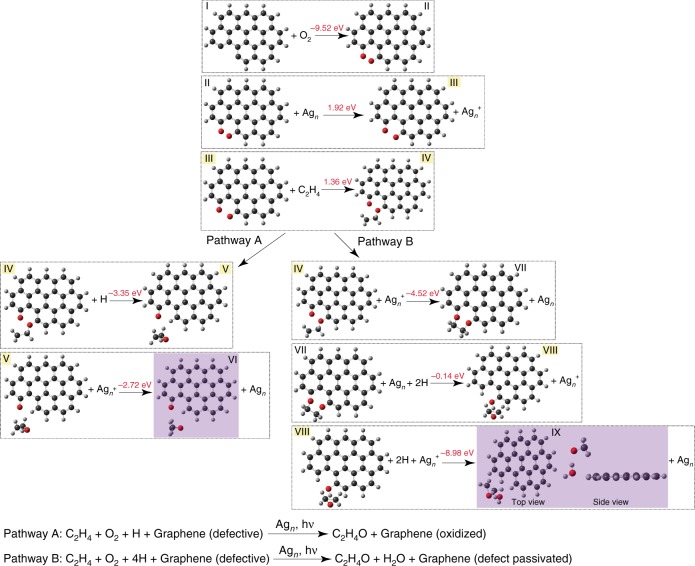
Fig. 4.
DFT simulation of the role of graphene nanofragments in catalysis. Two possible reaction pathways by which unterminated bonds of graphene nanofragments can participate in C2H4 epoxidation. Here and in molecular geometries in the Supplementary Information, O atoms are shown in red, C atoms in dark gray, and H atoms in light gray. Agn refers to the 15-atom Ag cluster model employed in DFT simulations. The arrow within each step signifies that a geometry optimization of the chemical species on the left leads to the species on the right. The product of each reaction pathway is shown by purple shading. Free energies for each elementary step are shown (atop each arrow), which were calculated from optimized geometries of gas phase species (I–IX) involved in each step. The species highlighted in yellow were assigned a −1 charge, to simulate the injection of a hot electron from Ag. The overall reaction for each pathway is shown at the bottom

