Fig. 4.
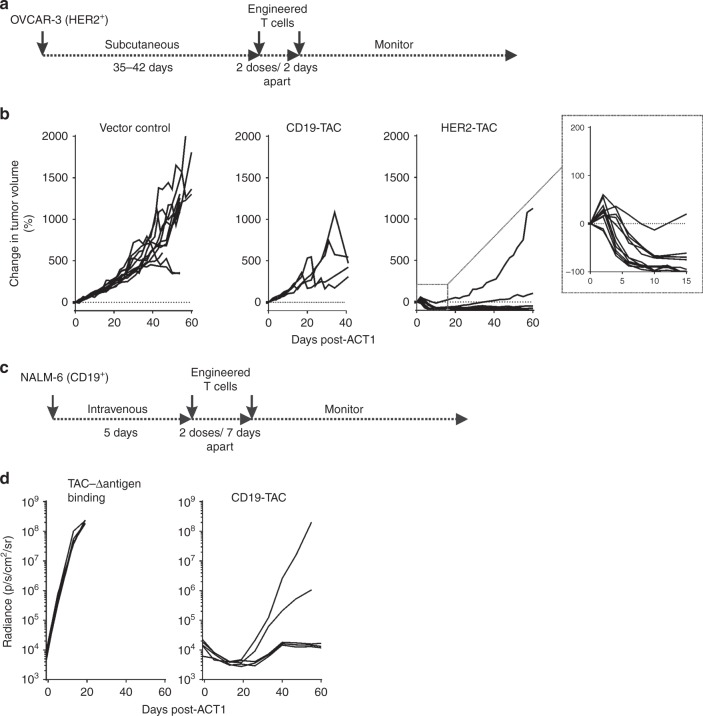
TAC-T cells demonstrate in vivo efficacy against solid and liquid tumors. a Treatment schema for OVCAR-3 tumor-bearing mice. In short, NRG mice receive 2.5 × 10⁶ OVCAR-3 cells subcutaneously. Tumors grow for 35–42 days until an average size of ~100 mm3 is achieved. T cells are delivered over two doses, 48 h apart. b Tumor-bearing mice receive intravenous delivery of 4–6 × 10⁶ HER2-TAC-T cells, CD19-TAC-T cells, or an equivalent dose of vector control T cells. Tumor growth is followed over time. Each curve shows data from a single treated tumor. Data are from three donors, collected over two independent experiments, n = 11 for each of HER2-TAC and vector control groups; CD19-TAC data generated from one donor, one experiment, n = 4. Using curve fitting analysis and multiple t-test HER2-TAC induced regression is significantly different from controls, while tumor growth between vector control and CD19-TAC was not significantly different. c Treatment schema for NALM-6 tumor-bearing mice. In short, 0.5 million NALM-6 cells are administered intravenously and allowed to establish for 5 days. Mice were treated with a total dose of 4 × 10⁶ cryopreserved CD19-TAC-T cells. T cells are delivered over two doses, 7 days apart. d Mice are treated with either TAC-Δantigen-binding domain or CD19-TAC-T cells. Curves each represent a single treated tumor. Data are from one donor, one experiment, n = 5 for each of CD19-TAC and control groups. Data have been replicated in independent experiments, n = 10. Tumor progression is followed weekly via luminescence

