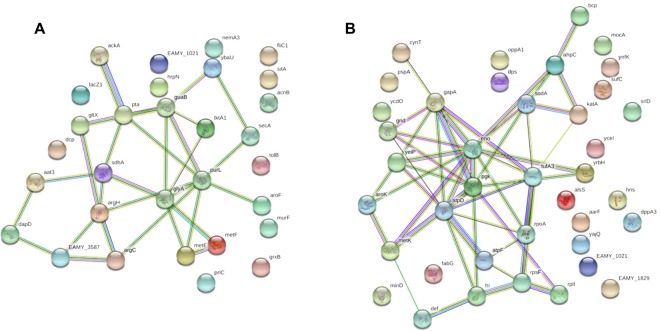
Figure 4.
Interaction network of differentially expressed proteins. For both conditions, in vitro (A) and in planta (B) an interaction network was developed containing all proteins shared by both strains in this condition. Colored nodes represent query proteins and first shell of interactions. Empty nodes indicate proteins of unknown 3D structure. Different line colors indicate the types of protein-protein associations: light blue (from curated databases) and purple (experimentally determined) indicate known interactions. Green (gene neighborhood), red (gene fusions), blue (gene co-occurrence), light green (text mining), black (co-expression) and light purple (protein homology) indicate predicted interactions.

