Figure 5.
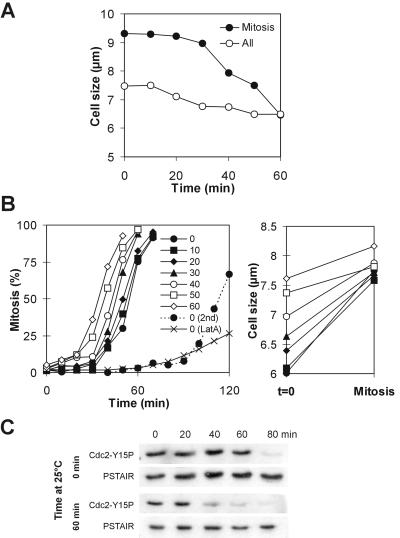
Mitotic initiation correlates with cell size in wee1-50ts mik1 cells. (A) Average cell sizes in an exponential culture of wee1-50ts mik1Δ cells. The cells were shifted to 36°C at t = 0. (B) Percentage of wee1-50ts mik1Δ cells synchronized in early G2 that have initiated mitosis (left) and average cell sizes at t = 0 and at mitosis (right). Cells were shifted to 36°C (t = 0) after indicated times spent at 25°C. The second mitosis is plotted for one culture (2nd) and 10 μM latrunculin A was added to another at time = 0 (Lat A) and entry into the first mitosis plotted. (C) Cdc2-Tyr15 phosphorylation in wee1-50ts mik1Δ cells synchronized in early G2 and grown at 25°C for indicated times before the shift to 36°C at t = 0.

