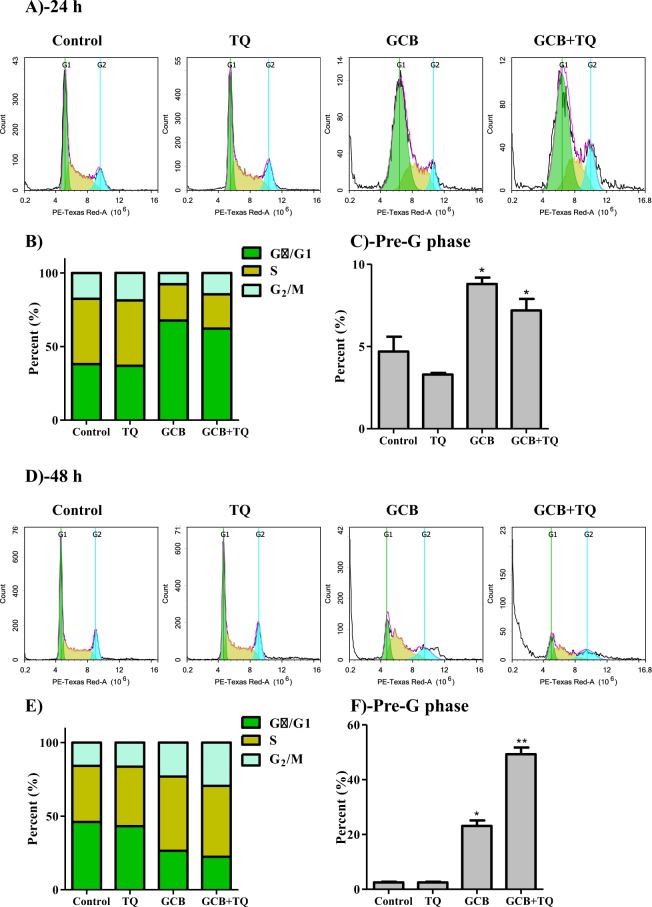
Figure 2.
Effect of GCB, TQ and their combination on the cell cycle distribution of MCF-7 cells. Cells were exposed to GCB, TQ or their combination for 24 h (A–C) or 48 h (D–F). Cell cycle distribution was determined using DNA cytometry analysis and different cell phases were plotted (B,E) as percentage of total events. Sub-G cell population was plotted as percent of total events (C,F). Data is presented as mean ± SD; n = 3. *Significantly different from control group. **Significantly different from GCB treatment.

