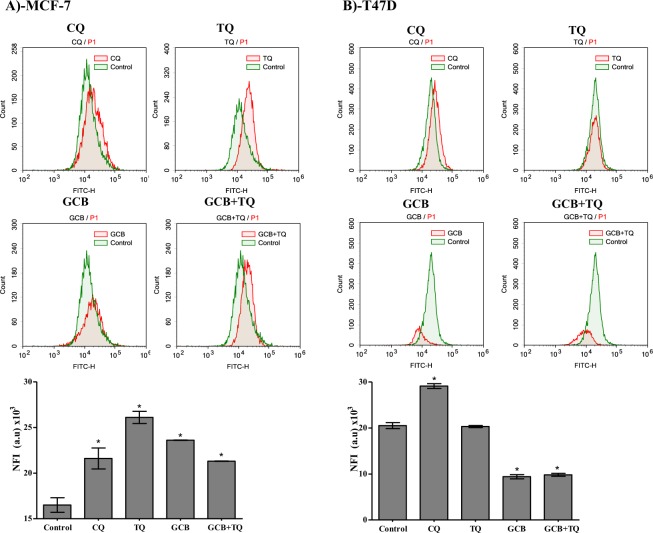
Figure 5.
Autophagic cell death assessment in MCF-7 (A) and T47D (B) cells after exposure to GCB, TQ and their combination. Cells were exposed to GCB, TQ or their combination for 24 h; and were stained with Cyto-ID autophagosome tracker. Net fluorescent intensity (NFI) were plotted and compared to basal fluorescence of control group. Data is presented as mean ± SD; n = 3. *Significantly different from control group. **Significantly different from GCB treatment.

