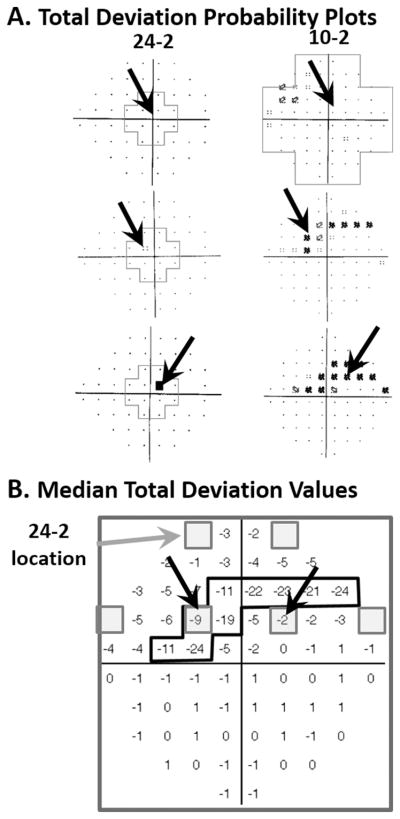
Figure 6.
Visual fields and OCT cpRNFL for an eye with advanced glaucoma. A. The 24-2 (left) and 10-2 (right) TD (upper panels) and probability (lower panels) plots. B. The cpRNFL thickness plot shown as a NSTIN plot (i.e., with the temporal quadrant in the middle). C. Upper panel: The circumpapillary image with the segmentation lines for the RNFL shown. The red arrow points to regions of preserved cpRFNL. The lower panel is the 10-2 probability map from panel A (lower right). The magenta and blue lines indicate the regions of cpRNFL and 10-2 that correspond with each other.

