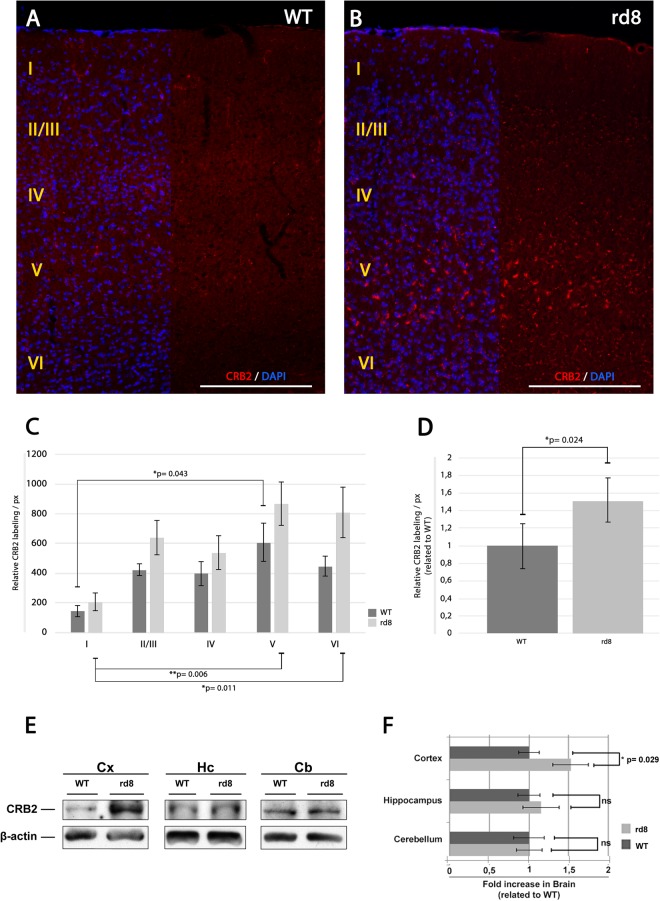
Figure 5.
CRB2 distribution in the mouse cortex. (A–B) Immunofluorescence CRB2 labeling of a sagittal section of the adult WT (A) and CRB1rd8. (B) Cortex of the mouse brain showing the protein distribution throughout the layers of the cortex. (C) Graph showing the quantification of the CRB2 relative labeling/px in the different layers of the cortex of WT and CRB1rd8 mice. (D) Graph showing the normalized quantification of the CRB2 relative labeling/px in the whole CRB1rd8 mouse cortex related to WT. (E–F) WB analysis of the expression of CRB2 in adult WT and CRB1rd8 mice brain. (E) Comparative CRB2 (150 kD) protein expression in WT and CRB1rd8 mice cortex, hippocampus and cerebellum areas. Blots were cropped from the same gel and quantitative comparisons were performed between samples of the same blot. Full-length blots are presented in Supplementary Fig. 4. (F) Graph obtained from data in E showing the comparative quantification of CRB2 protein expression in WT and CRB1rd8 mice cortex, hypothalamus and cerebellum. β-actin (42 kD) was used as the loading control. DAPI (in blue): nuclear labeling. Scale bars: 200 µm. Data are presented as mean ± s.e.m. Statistical information: The Kolmogorov Smirnov test was used to assess the normality of sample distribution. In C-WT, more than three groups were analyzed with one way-factorial ANOVA and the Bonferroni’s post-hoc test (n = 3). In C-rd8, more than three groups were analyzed with Kruskal Wallis test (n = 3). In D, two experimental groups were compared with the Student’s T test (n = 3). In F, in all cases, two experimental groups were compared with the Mann Whitney U test (n = 15). Asterisks indicate statistical differences. Two asterisks indicate highly statistical differences.

