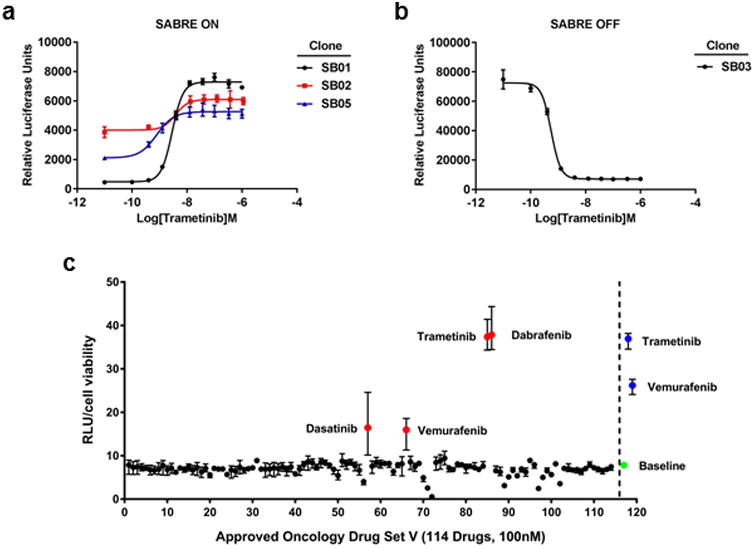
Figure 2. Identification of SABRE BRAF/MAPK pathway inhibitor gene trap clones.

Dose response curves of luciferase activity in (a) 3 SABRE ON clones and (b) 1 SABRE OFF clone in 96-well plate assays. (c) Scatter plot of the luciferase results from the NCI DTP set screen. The red dots indicate drugs that were identified from the DTP set. The blue dots indicate control drugs added to the screen (100nM trametinib, 100nM vemurafenib). The green dot represents the baseline luciferase activity with DMSO control.
