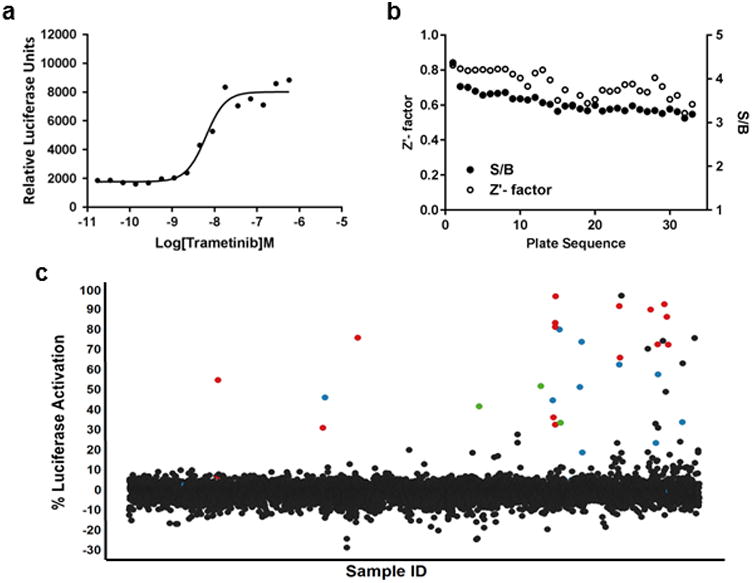
Figure 3. HTS campaign.

(a) The luciferase assay was miniaturized to a 1536-well format. (b) Clone SB01 was used to screen approximately 6000 compounds from several libraries, including the LOPAC, NPC and MIPE collections. The average Z′ factor for the screen was 0.7. (c) A scatter plot of the screening results demonstrates how well this assay performed. Blue dots represent BRAF inhibitors, red dots represent MEK inhibitors, and green dots represent ERK inhibitors.
