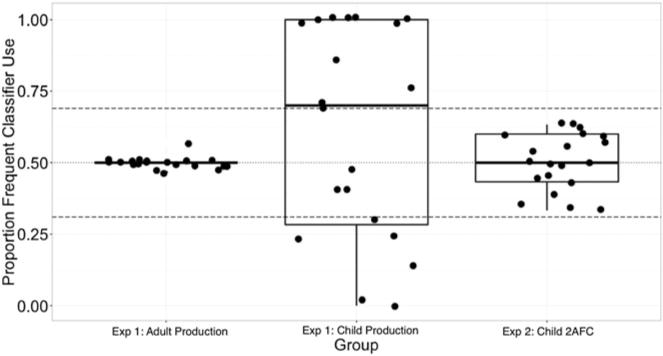
Figure 3.

Box-and-whiskers plot showing proportion classifier use (based on input frequency in the exposure phase) for each participant’s productions in Experiement 1 (Adult and Child Production groups) and for children’s choices in Experiment 2 (Child 2AFC group).
Notes. Dotted line at 0.5 indicates equivalent frequent/infrequent classifier proportion use (in line with correctly learning the semantic generalization). Dashed lines at .31 and .69 indicate markers of probability maximizing for either the more frequent or less frequent classifier. Note that the majority of children fell outside this band in their productions (17 out of 20 children; Experiment 1), while no children fell outside this band in the 2AFC task (Experiment 2).
