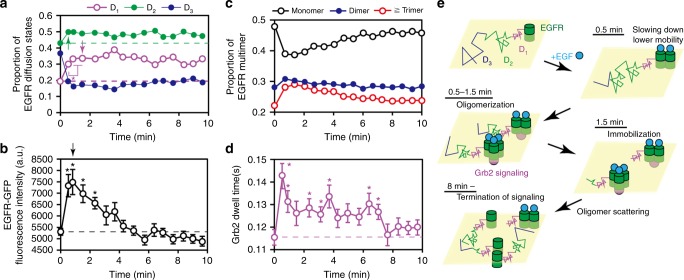
Fig. 5.
Time course of EGFR behavior after EGF stimulation. a Temporal changes in the fractions of the three EGFR states. Magenta, green, and blue circles indicate the immobile, slow-mobile, and fast-mobile fractions, respectively. Arrows indicate the first peaks of the immobile and slow-mobile states. The SE is shown in Supplementary Figure 8b. b Fluorescence intensity changes of EGFR-GFP. The arrow indicates the maximum intensity. c Cluster size changes calculated based on the fluorescence intensity histogram at each time point. Black, blue, and red circles indicate monomers, dimers, and oligomers larger than dimers, respectively. d Changes in the residence time of Grb2 on the plasma membrane. The dotted lines shown in a, b, and d indicate data obtained before the EGF addition. Asterisks indicate significant differences compared to the data from before the EGF addition (*P < 0.05). The number of data points is shown in Supplementary Table 1. Error bars: SE. e Scheme of the EGF-induced (cyan circle) behavioral transitions in EGFR (green cylinders), along with the receptor-evoked cell signaling via Grb2 (magenta circle). Magenta, green, and blue lines indicate immobile, slow-mobile, and fast-mobile EGFR, respectively

