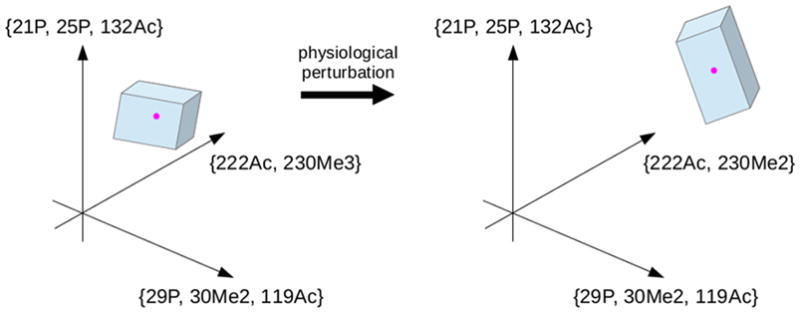
Figure 4.

Modform region and perturbation. A hypothetical modform region is shown, with the high dimensional space ℝ℘(S) restricted to three dimensions. The axes are labeled with hypothetical modform subsets using a notation that suggests how different types of PTMs—phosphorylation, acetylation, and methylation—can be described. The modform distribution, restricted to the three dimensions being shown, is the point (magenta) lying within the polyhedral modform region (blue). The position and shape of the modform region indicate what the MS data says about the modform distribution and the interplay between co-occurring PTMs. Physiological perturbations that alter the modform distribution can alter the position and shape of the modform region.
