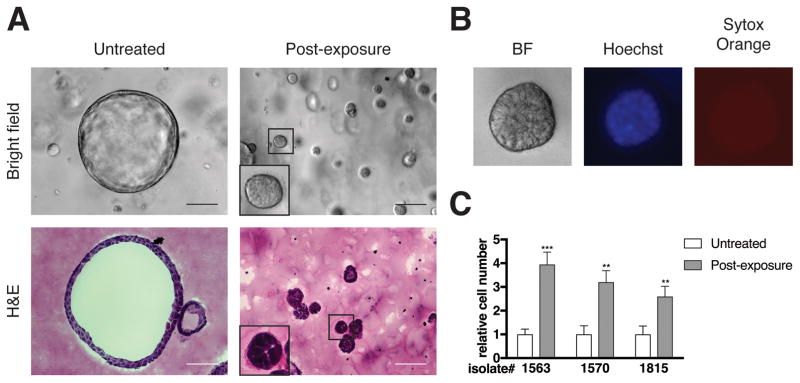
Figure 1. Transient TGF-β exposure alters the architecture and proliferation rate of KC cells.
Pancreas explants were harvested from LSL-KrasG12D;p48-Cre (KC, ref. 14) mice between 3.5 and 4.5 weeks of age as described previously (35), except that the cells were plated on Matrigel (354234, Corning; Corning, NY, USA). Following three days in culture at 37°C in 5% CO2 in air, the resulting ductal structures were removed from the Matrigel using Dispase (50 U/mL for 15 minutes at 37°C; 354235, Corning), trypsinized (0.05%, 2 × 3 minutes at 37°C, Gibco, Gaithersburg, MD, USA), and then embedded in Matrigel as described previously (16). Cells were treated without (untreated) or immediately with (post-exposure) human recombinant TGF-β1 (500 pg/mL; 240-B-002, R&D systems; Minneapolis, MN, USA) added to the culture medium. After two days, the TGF-β was removed and the cells were propagated for four weeks, after which experiments were performed. Media was replaced every two days. (A) Bright field images of live cells and hematoxylin and eosin (H&E; HHS32, HT110332 Sigma) stained sections are shown. Scale bars, 100 μm. (B) Bright field and fluorescent live images of TGF-β-treated cells stained with Hoechst 33342 (H1399, ThermoFisher; Waltham, MA, USA) and SYTOX Orange (S11368, ThermoFisher) according to the manufacturer’s protocols are shown. For (A) and (B), bright field and fluorescence images were obtained using a Zeiss Axiovert 200M microscope. Cells were prepared for cryosectioning (36) followed by H&E staining (16) as described previously with de-paraffinization and dehydration steps omitted, and imaged using a Nikon Eclipse 80i microscope. All images were processed using ImageJ and Adobe Photoshop software. Images are representative of five independent isolates. (C) Relative cell number of three independent isolates as determined by manual cell counting using a hemocytometer is shown. Error bars indicate mean +/− SD from independent experiments (n = 4–5). P values determined using a Student’s t test (unpaired, two tailed). **, P < 0.001. ***, p<0.0001. All animal care and procedures were approved by the Institutional Animal Care and Use Committee at NYU School of Medicine.

