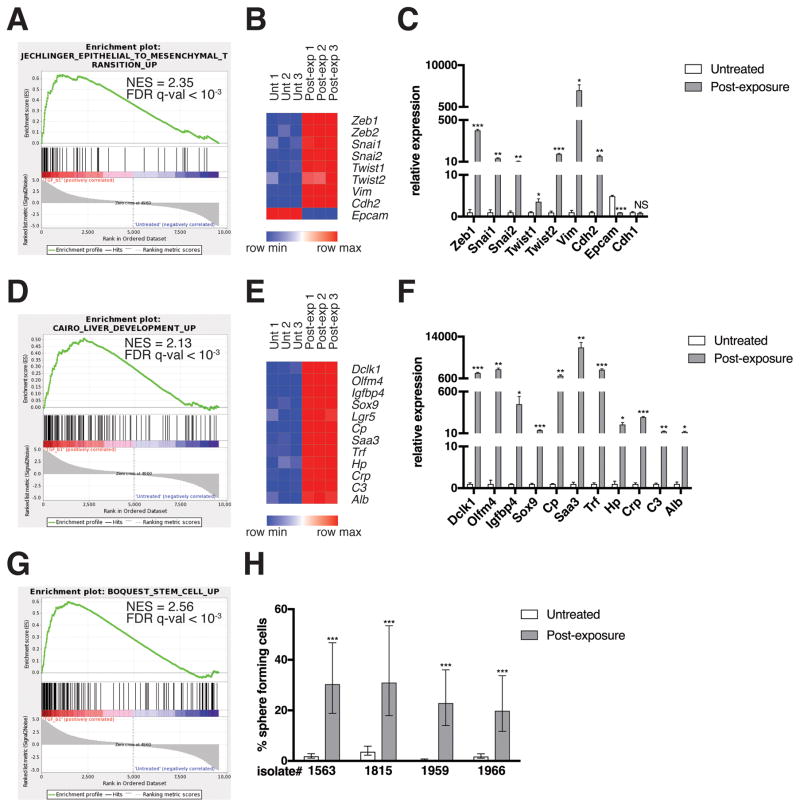
Figure 2. EMT and de-differentiation signature genes are enriched in post-TGF-β-exposure KC cells.
(A, D, G) GSEA enrichment plots of the indicated gene sets amongst the genes upregulated in post-TGF-β exposure KC cells relative to untreated KC cells are shown. NES, normalized enrichment score. RNA was isolated using an RNeasy mini kit (74104, QIAGEN; Venlo, Netherlands) from cells generated from LSL-KrasG12D;Pdx1-Cre;LSL-YFP (KCY)(18) mice, which behaved identically to KC cells. Three technical replicates per experimental group from one isolate were analyzed by RNA sequencing. Genomic DNA was removed using an RNase-free DNase kit (79254, QIAGEN). RNA sequencing was performed using an Illumina HiSeq2500 instrument. To generate differential expression values, sequencing results were demultiplexed and converted to FASTQ format using Illumina Bcl2FastQ software. Paired-end reads were aligned to the mouse genome (build mm10/ GRCm38) using the splice-aware STAR aligner (37). PCR duplicates were removed using the Picard toolkit (38). The HTSeq package (39) was utilized to generate counts for each gene based on how many aligned reads overlap its exons. These counts were then normalized and used to test for differential expression using negative binomial generalized linear models implemented by the DESeq2 R package (40). P values were corrected for multiple hypothesis testing using the Benjamini-Hochberg method (41). Results were considered significant when p < 0.05. This data is publicly available via the Gene Expression Omnibus (42), accession #GSE101659. The Gene Set Enrichment Analysis (GSEA) software (19) was run using the curated gene sets and oncogenic signatures from the Molecular Signatures Database (MSigDB). (B, E) Heat maps of representative EMT and de-differentiation signature genes are shown. Expression levels shown are representative of log2(x + 1) transformed normalized read counts in each replicate. Expression relative to the maximum (red) and minimum (blue) level per gene across samples is shown. Heat maps were generated using GENE-E software (43). (C, F) mRNA levels of differentially expressed genes as measured by qRT-PCR are shown. Reverse transcription was performed using a QuantiTect reverse transcription kit (205311, QIAGEN). USB HotStart-IT SYBR Green qPCR Master Mix (75762, Affymetrix; Santa Clara, CA, USA) was used for amplification. See Table S1 for a list of primers used in this study. Samples were amplified on the Stratagene Mx 3005P. Differences in expression were determined using the 2−ΔΔCT method (44) using RPS29 as a housekeeping control. Expression levels from one isolate representative of the four individual isolates tested are shown. Three technical replicates were used per experimental group per isolate. Error bars indicate mean +/− SD from three technical replicates. P values determined using a Student’s t test (unpaired, two tailed). *, P < 0.05. **, P < 0.001. ***, P < 0.0001. NS, not significant. (H) Quantification of sphere formation capacity is shown. One sphere formation assay was performed per isolate for the four individual isolates tested. Cells were plated at densities ranging from 2000 cells/well-0.25 cells/well, 8 replicates per dilution, under conditions described previously to enrich for mammary stem cells (17). Following a 7-day incubation, the presence or absence of spheres was ascertained using bright field microscopy. Data is represented as the estimated percentage of cells able to form spheres, as calculated using ELDA statistical software (45), with error bars indicating the upper and lower limits of a 95% confidence interval. P values for differences between groups were generated by the software. ***, P < 0.0001.

