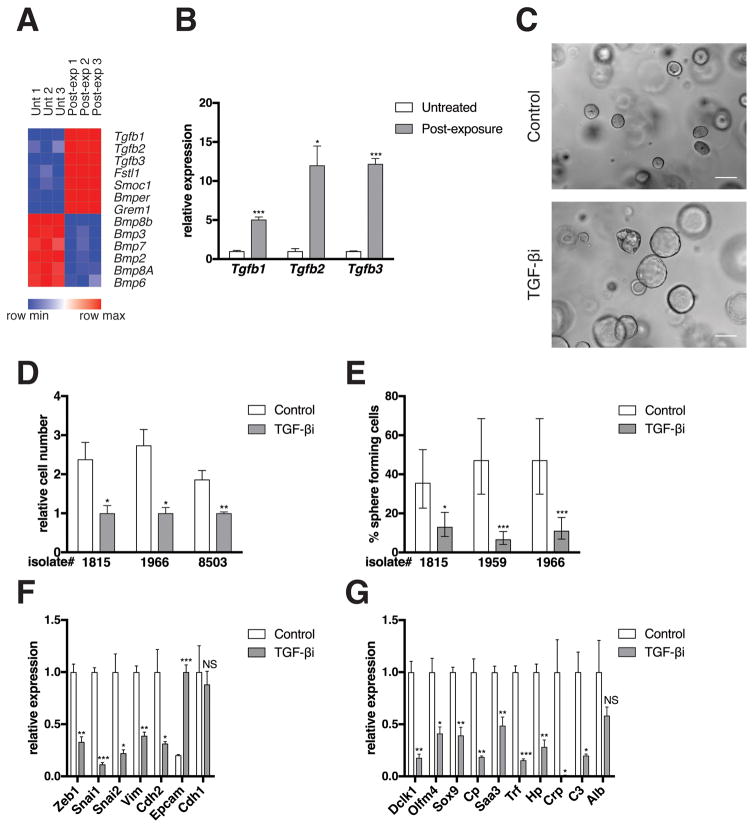
Figure 3. Autocrine TGF-β signaling maintains the PM phenotype.
(A) Heat map of TGF-β and BMP genes is shown. See Figure 2B for methods. (B) mRNA levels of differentially expressed genes as measured by qRT-PCR is shown. See Figure 2C for methods. (C) Bright field images are shown from a single isolate representative of three independent isolates tested. PM cells were either not treated (Control) or treated with the TGF-βR1 kinase inhibitor LY364947 (1 μg/mL; 616451, EMD Millipore; Mahopac, NY, USA) for six days (TGF-βi). Scale bars, 100 μm. See Figure 1A for image capture and processing methods. (D) Relative cell number of three independent isolates as determined by manual cell counting using a hemocytometer is shown (Cells from isolate 8503 were generated from a KCY mouse [see Figure 2A]). PM cells were treated with DMSO (Control) or LY364947 (TGF-βi) for six days. Error bars indicate mean +/− SD from three technical replicates. P values determined using a Student’s t test (unpaired, two tailed). *, P < 0.05. **, P < 0.001. (E) Quantification of sphere formation capacity is shown. PM cells were treated with DMSO (Control) or LY364947 (TGF-βi) for six days. One sphere formation assay was performed per isolate for the three isolates tested. See Figure 2H for methods. Data represented as described in Figure 2H. *, P < 0.05. ***, P < 0.0001. (F–G) mRNA levels of EMT (F) and de-differentiation signature (G) genes as measured by qRT-PCR is shown. PM cells were either not treated (Control) or exposed to LY364947 (TGF-βi) for six days. Expression levels from one isolate representative of the three individual isolates tested are shown. See Figure 2C for methods.

