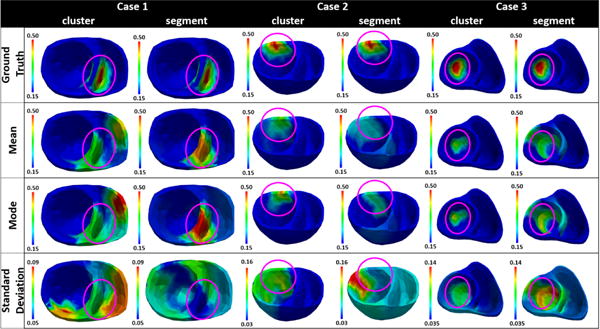
Figure 5.

Examples of parameter estimation results when using clusters from the adaptive method vs. segments from the uniform method as low-dimensional representation of the spatial parameter space. Case 1, case 2, and case 3 respectively show an example in which the infarct is represented better by the segments, equally by both segments and clusters, and better by the clusters in terms of parameter heterogeneity.
