
Figure 6.
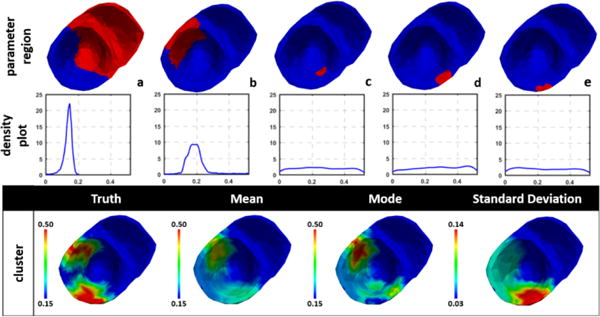
Example of high uncertainty associated with over-parameterization when the adaptive method assigned several small clusters to represent the heterogeneous regions around the infarct (c-e). Top row: clusters represented by one dimension of the parameter space. Middle row: univariate marginal density plot of the estimated parameter. Bottom row: estimated mean, mode and standard deviation of the parameter.