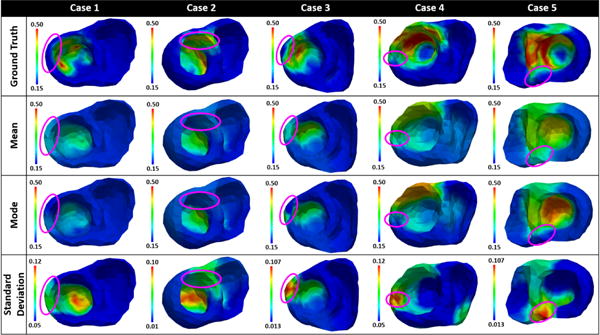
Figure 8.

Mean, mode, and standard deviation of posterior pdfs estimated from epicardial potentials simulated by a multi-scale ionic EP model blinded to the presented estimation method. Purple circles denote areas of non-transmural scars (cases 1, 2, and 3) or gray zones (cases 4 and 5).
