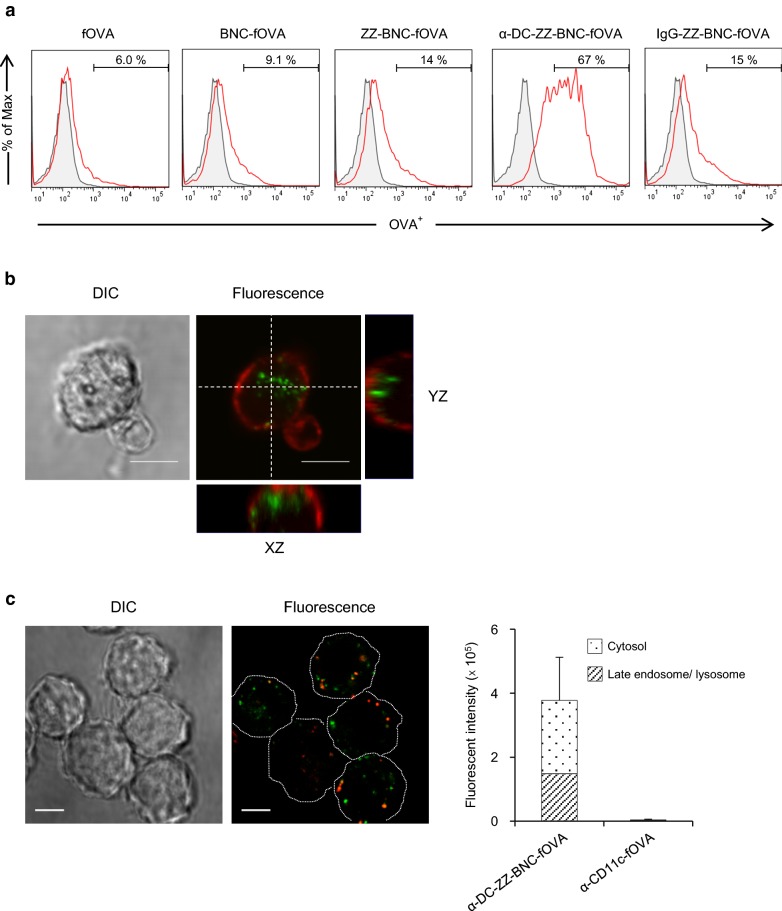
Fig. 1.
Cellular uptake of Ag-crosslinked α-DC-ZZ-BNC. a Isolated splenic DCs were incubated with each complex. The values were indicated percentages of fOVA+ cells in DCs. b The isolated DCs were treated with α-DC-ZZ-BNC-fOVA (green), and stained with wheat germ agglutinin (Red). Scale bars, 5 μm. c The DC2.4 cells were incubated with α-DC-ZZ-BNC-fOVA (green) and stained with LysoTracker Red (Red). Scale bars, 5 μm. Fluorescence intensity of fOVA in the DC2.4 cells was analyzed with an ImageJ software (N = 7, mean ± SEM)

