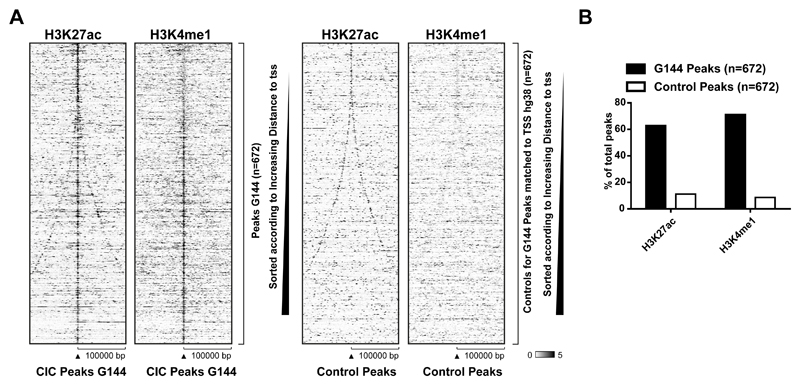
Figure 3. CIC targets are enriched for enhancer-associated histone marks.
A) Heatmaps showing ChIP-seq signals of H3K27ac and H3K4me1 at CIC peaks in G144 cells. A set of control regions with matched distance to TSS is depicted to the right. B) Percentage of CIC peaks or control regions overlapping with H3K27ac or H3K4me1 peaks in G144 cells.

