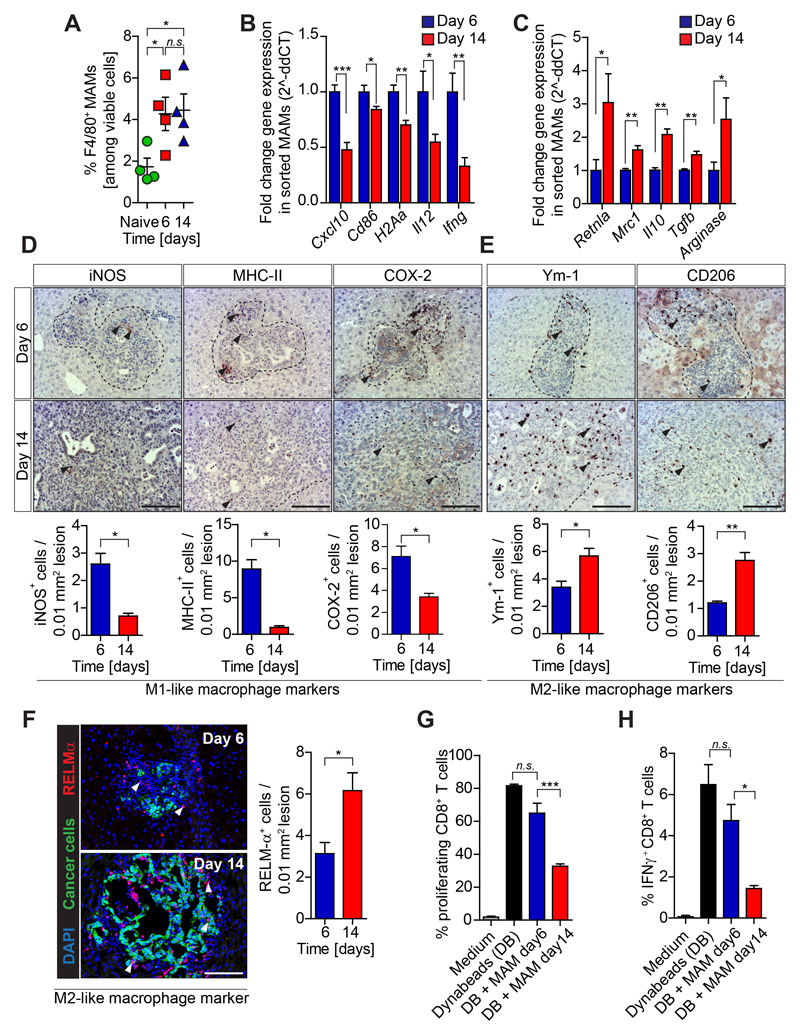
Figure 2. Immune suppressive macrophages accumulate in established PDAC metastasis.
Liver metastasis was induced by intrasplenic implantation of KPC luc/zsGreen cancer cells. Livers were resected 6 and 14 days (n= 4 mice / time point) and analyzed. (A) Flow cytometry quantification of F480+ cells in naïve and metastatic resected livers. (B-C) M1 and M2-macrophage associated genes expression in FACS isolated MAMs by qPCR. (D) Immunohistochemistry images and quantification of M1-like MAM markers and (E) M2-like MAM markers. (F) Immunofluorescent images and quantification of RELMα+ M2-like macrophages clustering around metastatic PDAC cells (zsGreen+).(G-H) MAMs isolated from resected livers were tested for their ability to (G) suppress CD28/CD3 Dynabeads (DB) stimulated splenic CD8+ T cell proliferation (CFSE dilution) (H) and activation (IFNγ level) (data are mean ± SD of 4 independent experiments). Scale bars= 100µm; ***, P<0.001; **, P < 0.01; *, P < 0.05; n.s., not significant, by unpaired t-test and/or Bonferroni multiple comparison.

