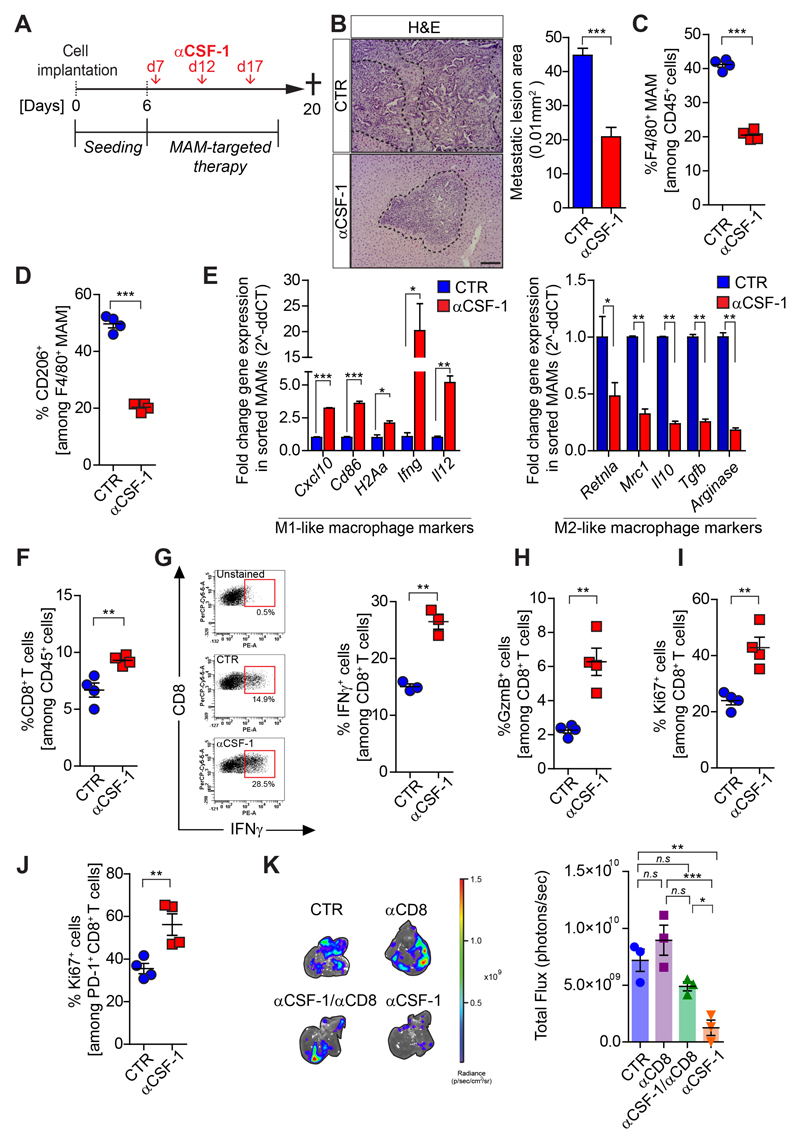
Figure 3. Pharmacological blockade of CSF-1 reprograms MAMs and reinvigorates CD8+ T cell functions.
Liver metastasis was induced by intrasplenic implantation of KPCzsGreen/luc cells. After 7 days mice were treated with IgG control (Ctr) or αCSF-1 antibody. Metastatic livers were resected at day 20 and analyzed by haematoxylin and eosin (H&E) staining (n=6 mice/group) and by flow cytometry (n=4 mice/group). (A) Schematic illustration of the experiment. (B) H&E images and quantification. (C) Total and (D) M2-like (CD206+) MAMs. (E) M1-like and M2-like macrophage genes expression analysis in MAMs (F) Quantification of CD8+ T cells. (G) Representative dot plot and quantification of IFNγ levels in CD8+ T cells (n = 3 mice /group); Quantification of (H) Granzyme B+ (GzmB) cells, (I) proliferating (Ki67+) cells among total CD8+ T cells and among (J) PD-1+ CD8+ T cells. (K) Metastatic tumor burden in mice treated with αCD8 and αCSF-1 alone or in combination (n = 3 mice /group).
Scale bars = 100µm; ***, P<0.001; **, P < 0.01; *, P < 0.05; n.s., not significant, by unpaired t-test and/or Bonferroni multiple comparison.

