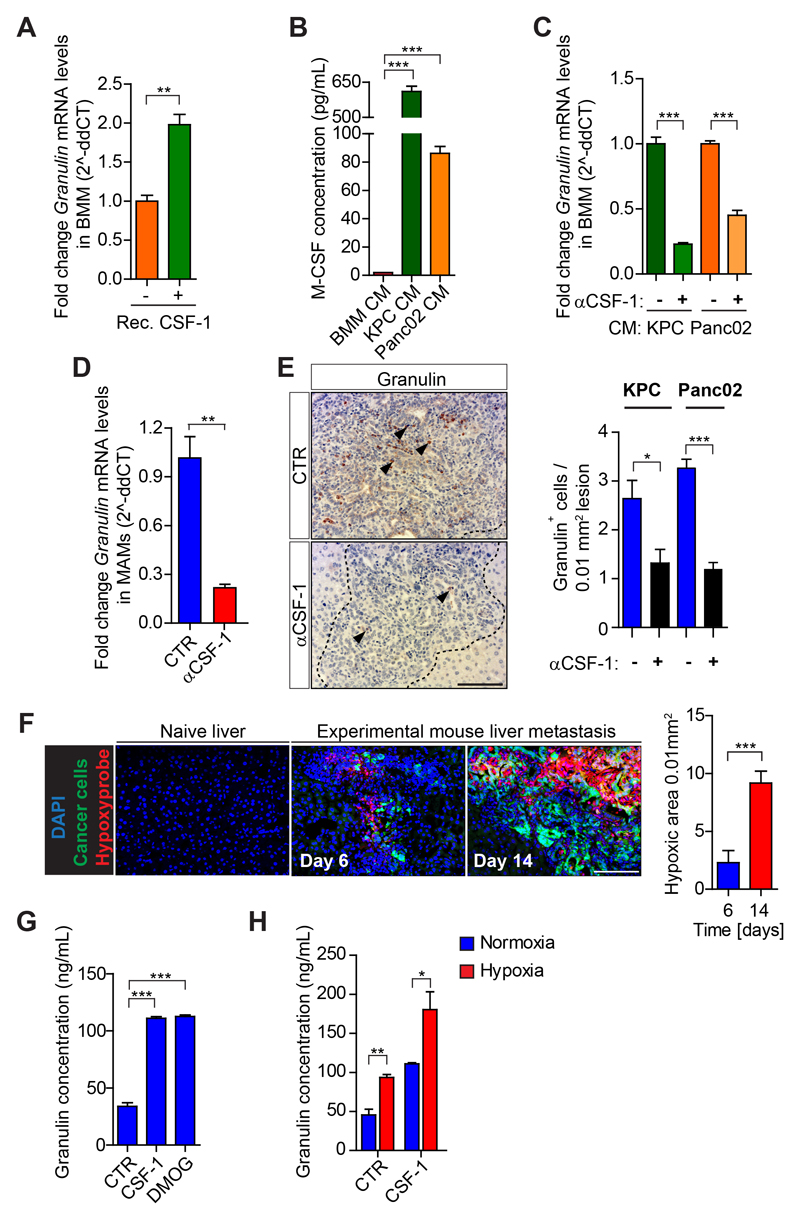
Figure 5. Hypoxia amplifies CSF-1-induced granulin expression in macrophages.
(A) Quantification of Granulin expression by qPCR in primary bone marrow derived macrophages (BMMs) unstimulated and exposed to recombinant CSF-1. (B) ELISA quantification of CSF-1 protein levels in conditioned medium (CM) generated from BMMs, and KPC and Panc02 pancreatic cancer cells. (C) Quantification of Granulin expression by qPCR in BMMs exposed to KPC and Panc02 conditioned media (CM) in the presence of IgG control (Ctr) or neutralizing αCSF-1 mAb. (D) Quantification of Granulin expression in MAMs from KPCzsGreen/luc induced metastatic tumors treated with IgG control (Ctr) or αCSF-1. (E) Immunohistochemistry images and quantification of granulin in KPCzsGreen/luc or Panc02 zsGreen/luc tumor bearing mice treated with IgG control (Ctr) or αCSF-1 (n = 4 mice). (F) Representative images and quantification of hypoxic areas surrounding metastatic KPCzsGreen/luc cells (zsGreen+) assessed by Hypoxyprobe™-1 (n= 3 mice / group). (G-H) ELISA quantification of (G) granulin protein level in unstimulated BMMs (Ctr), and BMMs exposed to recombinant murine CSF-1 or DMOG for 24 hours and (H) granulin protein level in BMMs cultured for 24 hours under normoxic and hypoxic conditions in presence or absence of recombinant murine CSF-1. In A-C, G-H data are mean ± SD of 3 independent experiments. Scale bars= 100µm; ***, P<0.001; **, P < 0.01; *, P < 0.05; n.s., not significant, by unpaired t-test.

