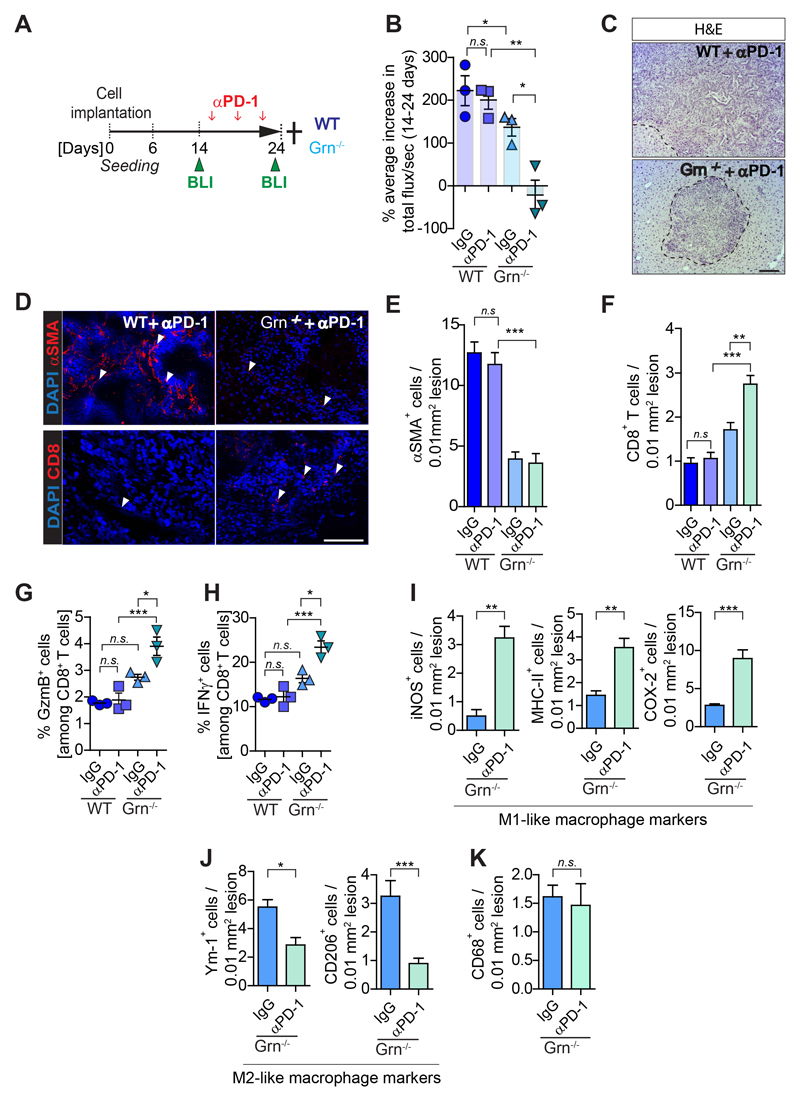
Figure 7. Depletion of granulin restores response of metastatic PDAC to αPD-1 therapy.
Liver metastasis was induced by intrasplenic implantation of KPCzsGreen/luc cells in WT and Grn-/- mice. Mice were treated with control IgG or αPD-1. Change in tumor burden was quantified by in vivo BLI. (n= 3 mice/group). (A) Schematic illustration of the experiment. (B) Change in metastatic tumor burden (total flux/sec). (C) H&E images of αPD-1 treated cohorts. Metastatic lesions are delineated with dashed lines. (D) Immunofluorescence images of myofibroblasts (αSMA+) and CD8+ T cell staining of sequential liver sections from WT and Grn-/- mice treated with αPD-1. (E-F) Quantification of myofibroblasts (αSMA+) accumulation and CD8+ T cell infiltration as described in D. Quantifications of (G) Granzyme B (GzmB+) and (H) IFNγ+ CD8+ T cells by flow cytometry analysis. (I-K) Immunohistochemistry images and quantification of cells positive for (I) pro-inflammatory M1-like (iNOS, MHC-II, COX-2) MAMs, (J) anti-inflammatory M2-like (Ym-1, CD206) MAMs and (K) total (CD68) MAMs markers. Scale bars= 100µm; ***, P<0.001; **, P < 0.01; *, P < 0.05; n.s., not significant, by unpaired t-test and/or Bonferroni multiple comparison.

