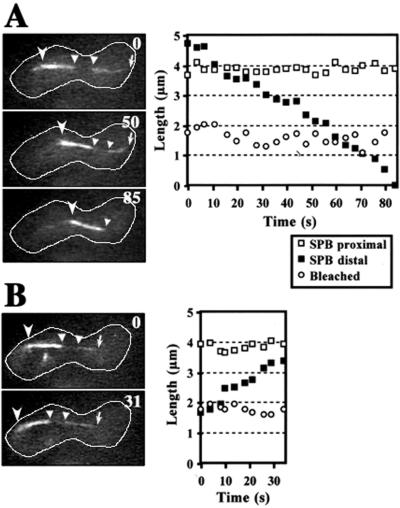
Figure 6.
Photobleaching of GFP-labeled microtubules during nuclear oscillation. The GFP signal of a bundle of microtubules was photobleached in the middle and the bundle was examined at a single focal plane (see MATERIALS AND METHODS). Shortening (A) and elongation (B) of the photobleached microtubule bundle. Left photos indicate images of the photobleached microtubule bundle. Numbers indicate time in seconds. Barbed and small arrowheads indicate a microtubule focus and the bleached microtubule region, respectively. Arrows indicate the end of the microtubule bundle distal to the SPB. White lines indicate the cell cortex. Right graphs show lengths of GFP-labeled and -bleached microtubule regions versus time. Open and closed squares indicate lengths of GFP-labeled regions proximal and distal to the SPB, respectively. Open circles indicate lengths of the bleached microtubule region.

