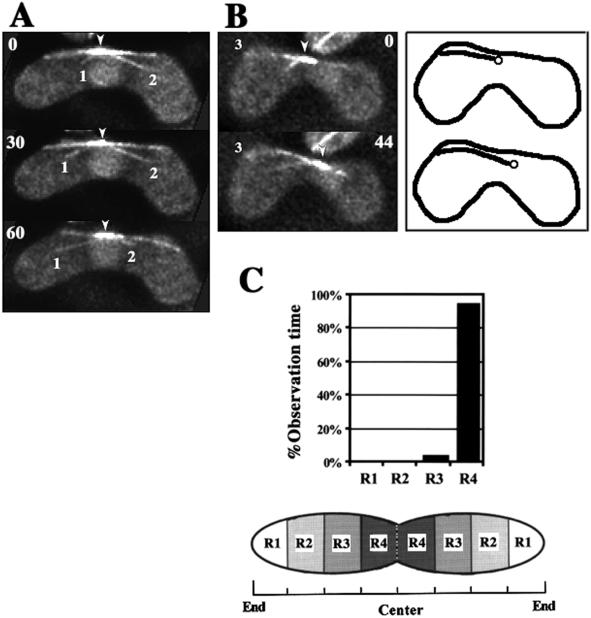
Figure 8.
Microtubule behavior and SPB position in the dhc1− mutant cells. (A and B) Projections of the mutant cells containing GFP-labeled microtubules. Cartoons on the right in B show the SPB (circles), microtubule 3 (solid lines extending from the circles), and the cell cortex (solid lines). Barbed arrowheads indicate positions of a microtubule focus. Large numbers indicate time in seconds. Small numbers indicate microtubule numbers. (C) Frequency of the positions of the SPB within the cell. Positions of the SPB were examined in eight independent cells with total observation time of 42 min and 46 s.

