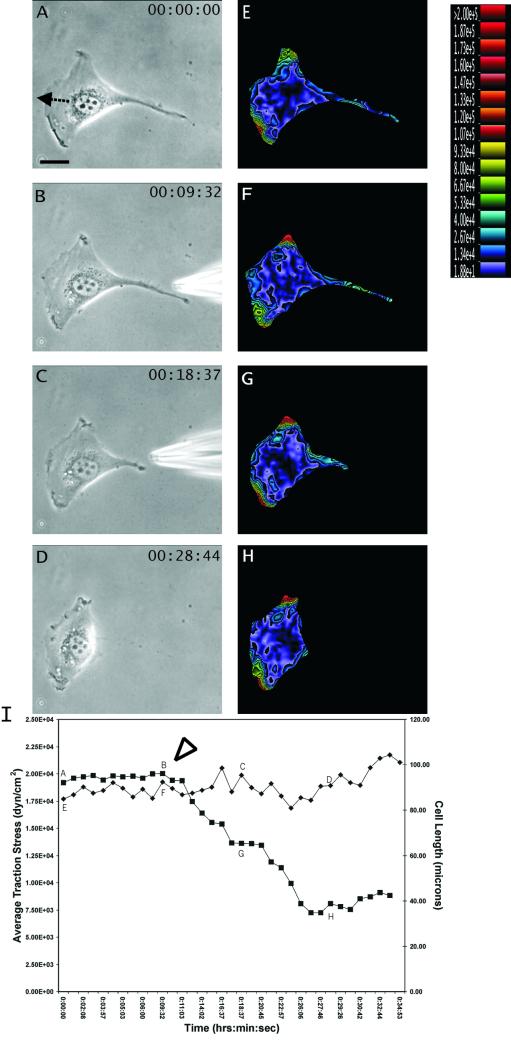
Figure 2.
Response of traction forces to GRGDTP-induced tail retraction. (A–D) Phase contrast images of a migrating NIH 3T3 fibroblast, recorded at time points indicated at the upper right corner. The needle releasing GRGDTP is seen in B and C. Arrow in A indicates the direction of cell migration. (E–H) Color rendering of the corresponding magnitude of traction stress, which ranges from 1.88 × 101 dynes/cm2 (violet) to >2.00 × 10⁵ dynes/cm2 (red). Note the increase in traction stress at the leading edge after GRGDTP-induced retraction of the tail. (I) Average magnitude of traction stress (♦) and cell length (▪) during GRGDTP-induced tail retraction. Letters A–H mark the corresponding panels. The arrowhead indicates the time when the GRGDTP peptide was locally applied to the trailing edge. Bar, 20 μm.

