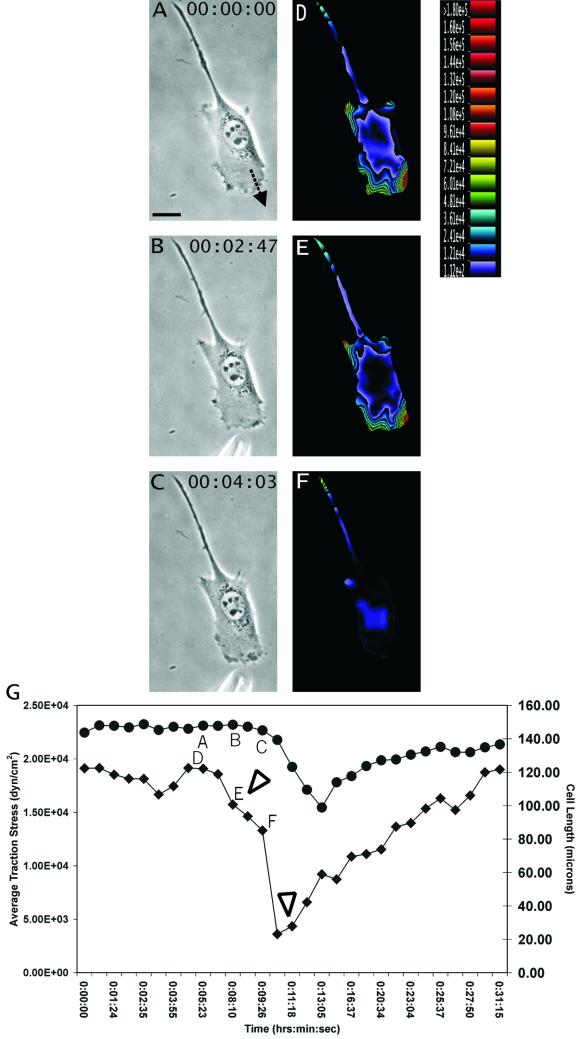
Figure 3.
Response of traction forces to GRGDTP-induced frontal release. (A–C) Phase contrast images of a migrating NIH 3T3 fibroblast, recorded at time points indicated at the upper right corner. The needle releasing GRGDTP is located near the bottom of B and C. Arrow in A indicates the direction of cell migration. (D–F) Color rendering of the corresponding magnitude of traction stress, which ranges from 1.12 × 10² dynes/cm2 (violet) to >1.80 × 10⁵ dynes/cm2 (red). (G) Average magnitude of traction stress (♦) and cell length (●) during GRGDTP-induced frontal release. Letters A–F mark the corresponding panels. The first arrowhead indicates the time when GRGDTP peptide was locally applied to the leading edge, causing a sharp drop in the average traction stress. The second arrowhead indicates the time when the needle releasing GRGDTP was removed. Note that upon local detachment of the leading edge, traction stress decreases dramatically across the entire cell, while the length of the cell decreased only slightly (G; time ∼11:00). The average traction stress recovers to the previous level over a period of 10–20 min. Bar, 20 μm.

