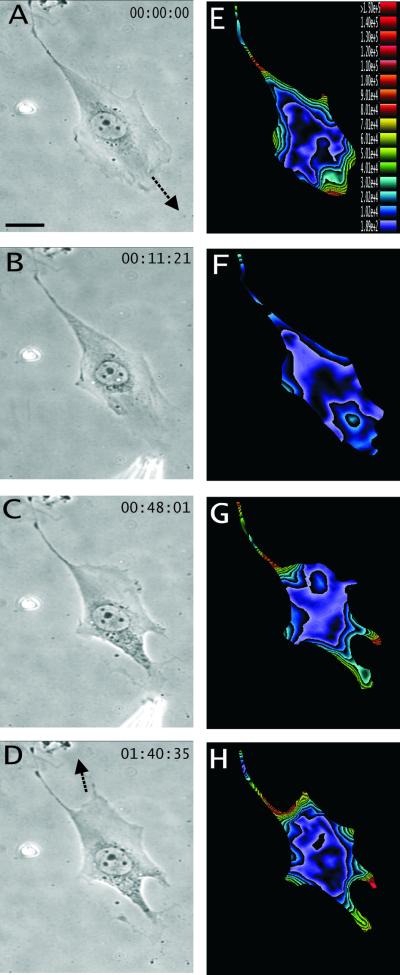
Figure 4.
Redirection of cell migration after persistent treatment of the GRGDTP peptide at the front. (A–D) Phase contrast images of a migrating NIH 3T3 fibroblast, recorded at time points indicated at the upper right corner. Arrows in A and D indicate the initial and final direction of cell migration, respectively. (E–H) Color rendering of the corresponding magnitude of traction stress, which ranges from 1.89 × 10² dynes/cm2 (violet) to >1.50 × 10⁵ dynes/cm2 (red). The cell changes its direction of migration after persistent frontal treatment with GRGDTP. A region near the original tail expands into a new lamellipodium with a concomitant increase in traction stress. Bar, 20 μm.

