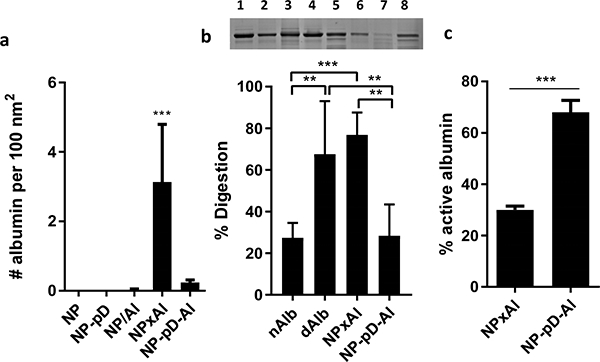
Fig. 2.

(a) The number of albumin per 100 nm2 of NP surface area. n = 4 identically and independently prepared samples (mean ± s.d.). ***: p < 0.001 vs. NP by Dunnett’s multiple comparisons test following one-way ANOVA. (b) Top: Representative SDS-PAGE gel image of albumin after pulse proteolysis. Native albumin (nAlb), denatured albumin (dAlb), NPxAl, and NP-pD-Al were treated with thermolysin for 3 min. Lane 1: nAlb; Lane 2: dAlb; Lane 3: NPxAl; Lane 4: NP-pD-Al; Lane 5: nAlb + thermolysin; Lane 6: dAlb + thermolysin; Lane 7: NPxAl + thermolysin; and Lane 8: NP-pD-Al + thermolysin. Bottom: % digestion albumin was defined as (1-albumin band intensity after proteolysis / albumin band intensity prior to proteolysis) × 100. N = 5 independently and identically performed experiments (mean ± s.d.). **: p < 0.01 and ***: p < 0.001 by Tukey’s multiple comparisons test following one-way ANOVA. (c) Active albumin content determined by esterase assay. % active albumin = esterase active albumin / the total amount of albumin determined by SDS-PAGE. n = 3 independently and identically performed experiments (mean ± s.d.). ***: p < 0.001 by unpaired t-test.
