
Fig. 4.
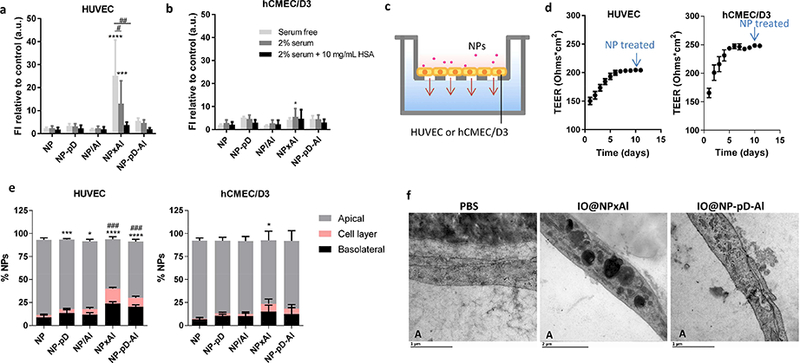
Interactions of NPs with (a) HUVEC (gp60+) and (b) hCMEC/D3 (gp60−) cells in the serum-free, 2% serum-supplemented media (containing 0.7 mg/mL albumin), and 2% serum-supplemented media with additional 10 mg/mL albumin, determined by flow cytometry. Cells were incubated with NPs (0.1 mg/mL) for 1 h. Fluorescence intensity (FI) was normalized by FI of control (untreated cells). n = 3 identically and independently prepared samples (mean ± s.d.). *: p<0.05; ***: p < 0.001; ****: p<0.0001 vs. NP; #: p<0.0005; ##: p < 0.0001 by Dunnett’s multiple comparisons test following two-way ANOVA. (c) Schematic of the Transwell system with endothelial cells seeded on an insert (pore size 3 μm). (d) Trans-Epithelial Electrical Resistance (TEER) of HUVEC and hCMEC/D3 cells layer (n = 36 wells, mean ± s.d.). (e) NP transport across HUVEC and hCMEC/D3 cells layer after 6 h of incubation with rhodamine-labeled NPs (0.1 mg/mL) in 2% serum-supplemented medium. n = 3 identically and independently prepared samples (mean ± s.d.). ###: p<0.0001 vs. NP in cell layer; *: p < 0.05; ***: p < 0.001; ****: p < 0.0001 vs. NP in the basolateral side by Dunnett’s multiple comparisons test following two-way ANOVA. (f) Transmission electron micrographs (TEM) of HUVECs incubated with PBS, iron oxide-loaded NPxAl (IO@NPxAl) or NP-pD-Al (IO@NP-pD-Al) for 6 h. “A” indicates the apical side of Tr answell insert. Scale bars = 1 μm for PBS and IO@NP-pD-Al; 2 μm for IO@NPxAl.