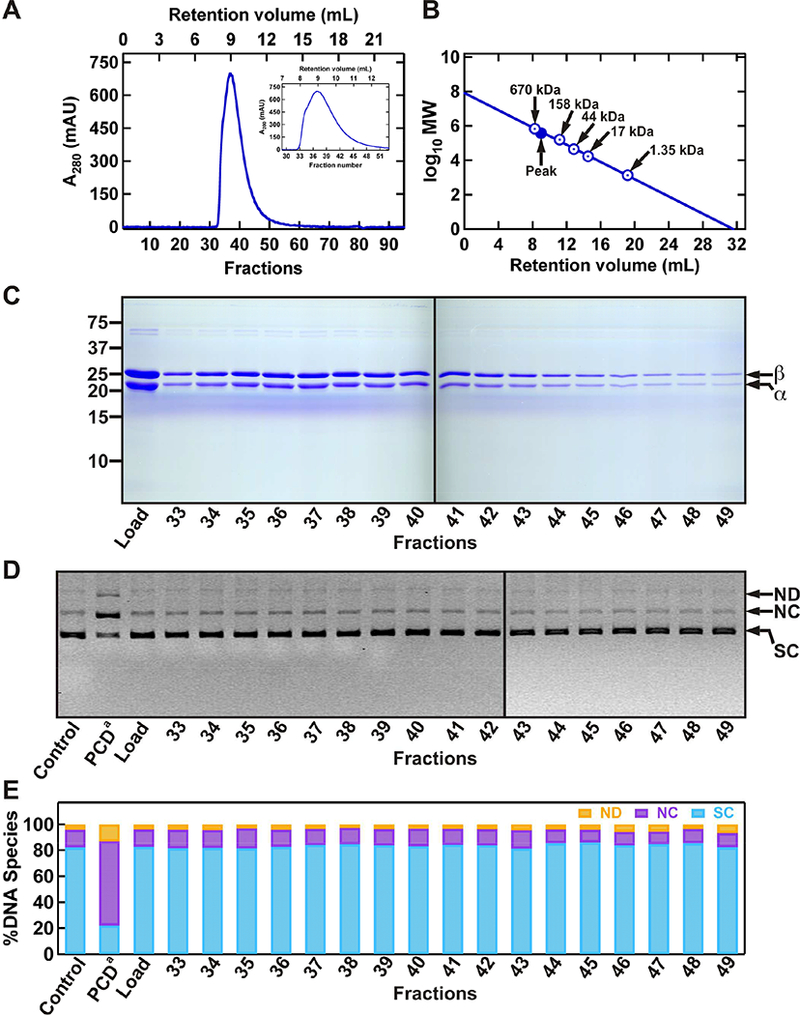
Figure 3. The second step of purifying PCD by size exclusion chromatography, and testing of protein fractions for DNA damaging activities.

(A) Chromatogram of PCD fractions on the Sp12 gel filtration column. Proteins mainly elute from ~8–11 mL retention volumes (440–670 kDa MW), also shown in zoomed-in view in the inset. (B) MW calibration curve showing the sizes in kDa for the globular molecular weight standards (Bio-Rad), and the position of peak PCD fractions (#36 and #37). (C) Analysis of protein fractions using SDS-PAGE. (D) Evaluation of protein fractions for any DNA damaging activity using a supercoiled (SC) DNA substrate. (E) Quantification of relative amounts of different DNA species present in each reaction. The resulting products include: nicked dimer (ND), nicked circular monomer (NC), linear DNA (LN). PCD from Sigma-Aldrich (PCDa) at 1XSM (~60 nM) was used as a positive control for nuclease activity.
