
Figure 3.
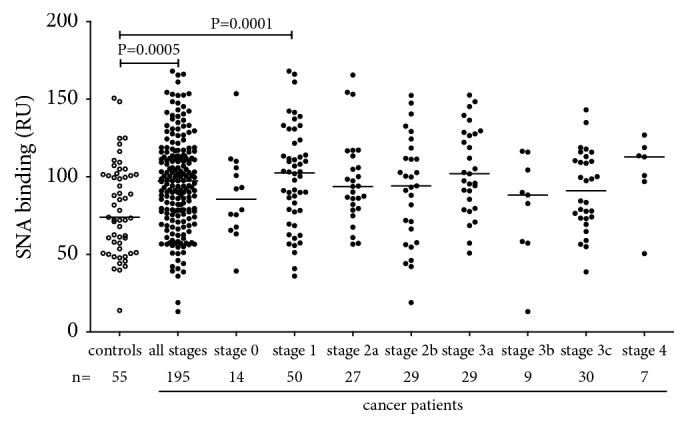
The binding of SNA lectin to TF-specific antibodies in the serum samples of cancer patients and controls. The group median is indicated by horizontal lines. P values are shown for significant differences.
Official websites use .gov
A
.gov website belongs to an official
government organization in the United States.
Secure .gov websites use HTTPS
A lock (
) or https:// means you've safely
connected to the .gov website. Share sensitive
information only on official, secure websites.
The binding of SNA lectin to TF-specific antibodies in the serum samples of cancer patients and controls. The group median is indicated by horizontal lines. P values are shown for significant differences.