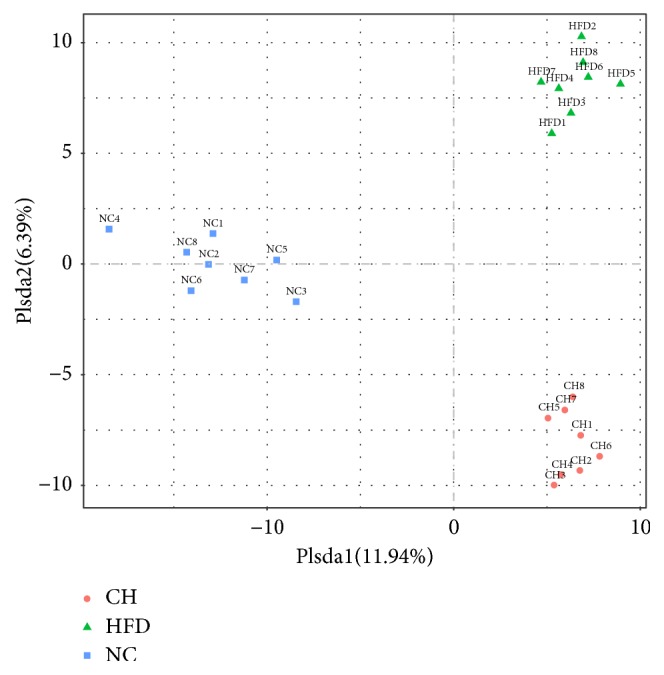
Figure 2.

OTU principal component analysis (PCA). The vertical and ordinate are the first and second principal components, and the percentage in parentheses indicates the contribution of the principal component to the sample difference. The points on the graph indicate the individual samples. Different colors represent samples belonging to different groups.
