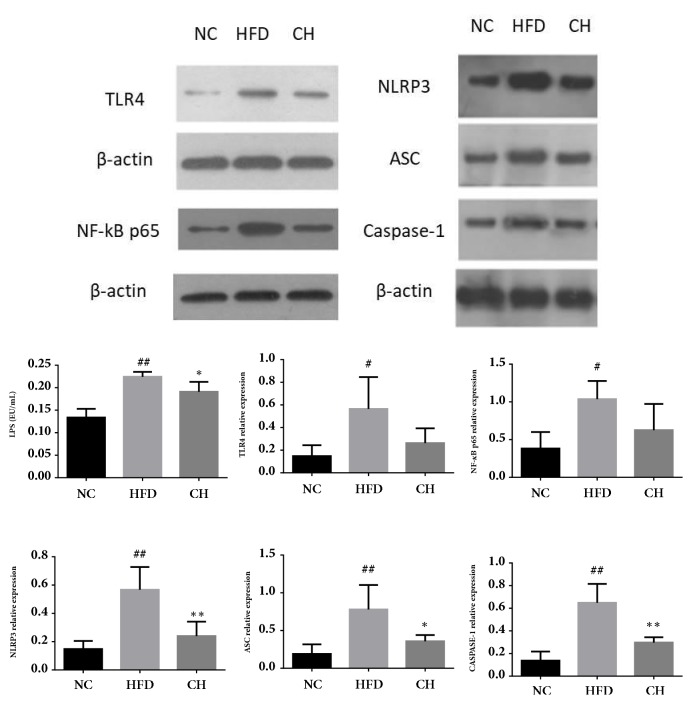
Figure 7.
Serum LPS and protein expression of TLR4, NLRP3, ASC, Caspase-1, and NF-kB p65 in SD rats fed a control diet or a HFD supplemented with Chaihu-Shugan-San for 16 weeks. These proteins were quantified via western blotting in the hepatic tissue. #P < 0.05 NC versus HFD, ##P < 0.01 NC versus HFD, ∗P < 0.05 HFD versus CH, and ∗∗P < 0.01 HFD versus CH, n=4.

