Figure 1.
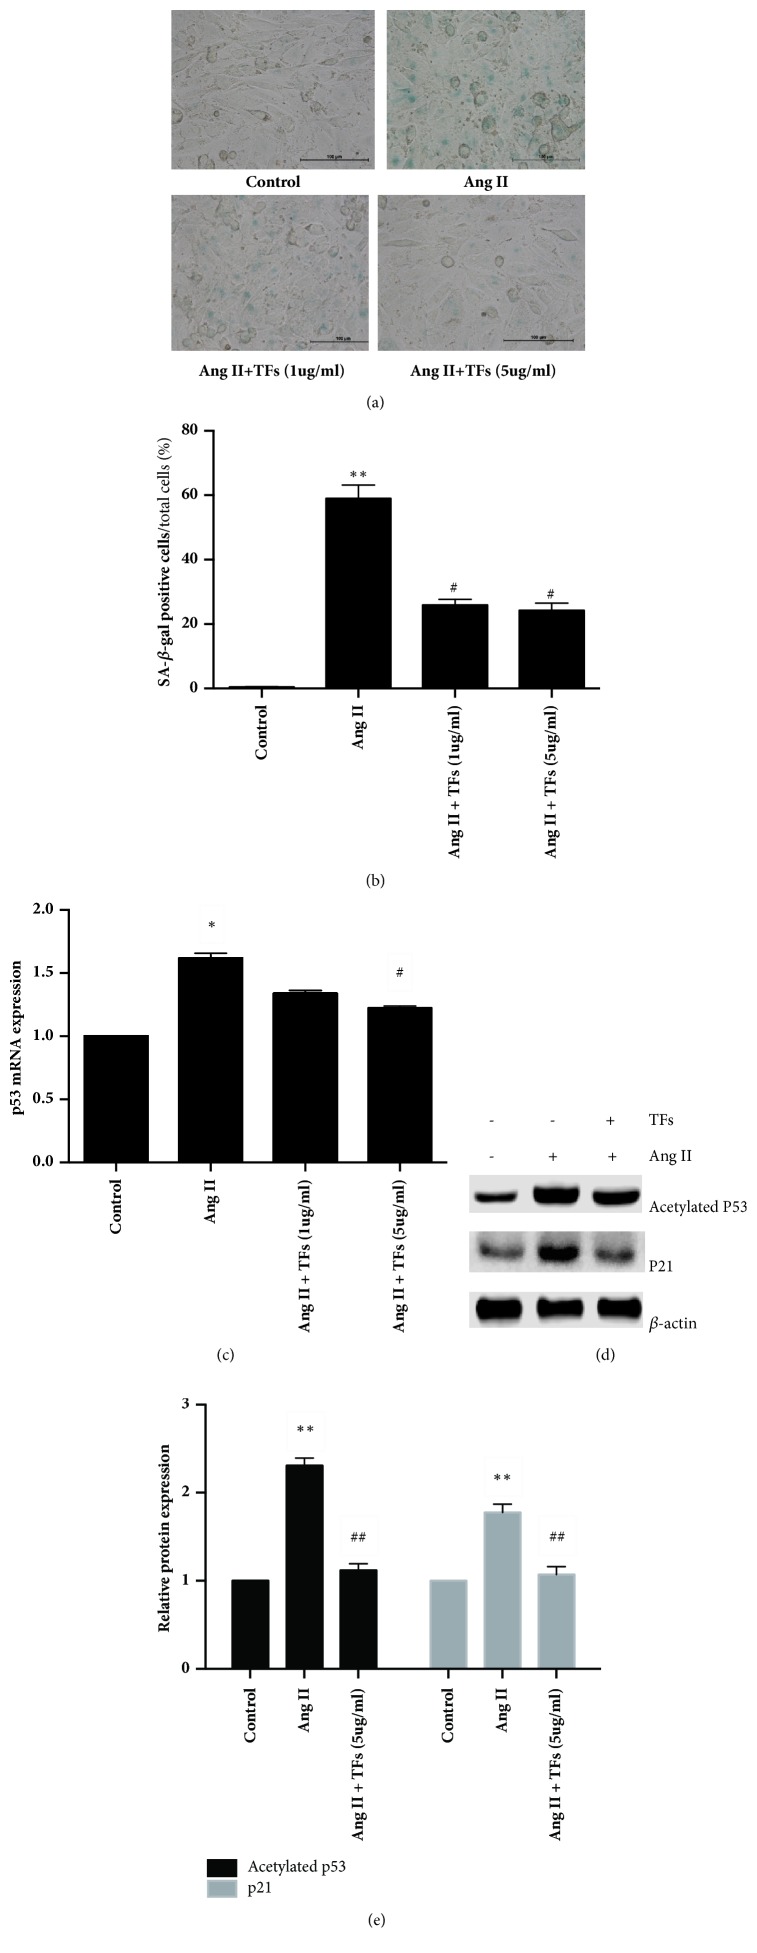
TFs could inhibit HUVECs senescence. Panels (a and b): representative images of SA-β-gal staining and quantification of SA-β-gal positive cells (blue staining for the senescent cell). Scale bar = 100 μm. Panel (c): quantitative analysis of p53 in HUVECs. Panels (d and e): representative images of WB analysis and the semiquantification of p53 or p21 in HUVECs. Values in panels (b, c, and e) are expressed as mean ± SD (n = 3). ∗p < 0.01 and ∗∗p < 0.01 versus control; #p < 0.05 and ##p < 0.01 versus Ang II.

