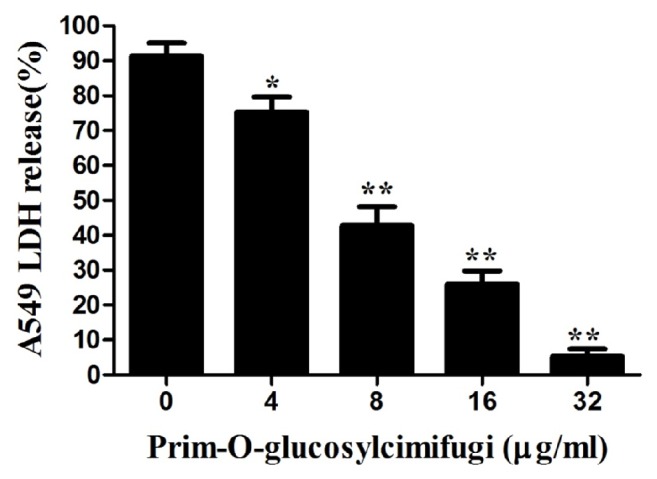
Figure 7.

LDH release by A549 cells was quantified using a microplate reader at 490 nm. The samples were tested after exposure to certain concentrations of prim-O-glucosylcimifugin. The data are displayed as the means from three independent experiments. ∗P < 0.05 and ∗∗P < 0.01, compared with prim-O-glucosylcimifugin-free culture.
