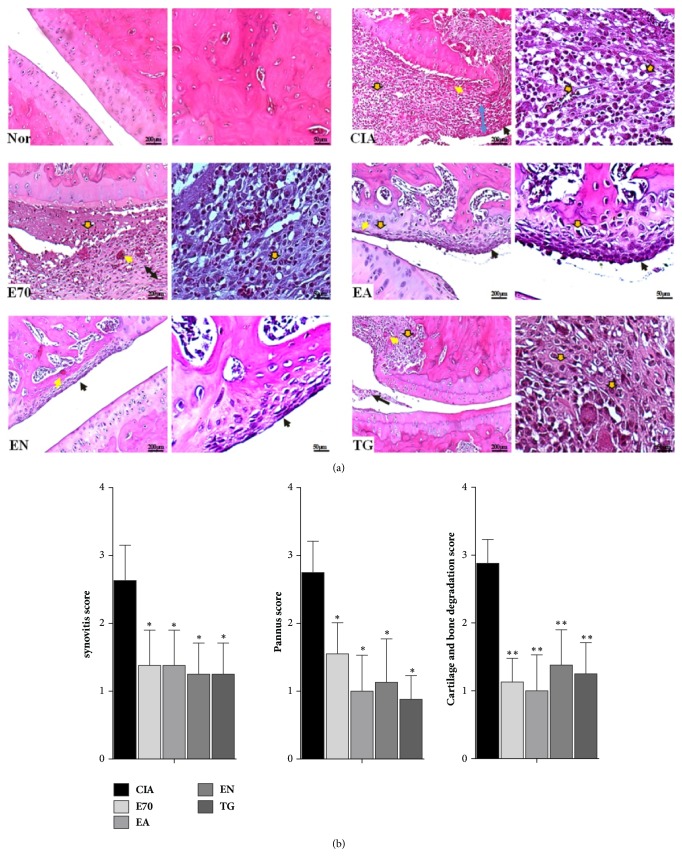
Figure 2.
Photomicrographs of pathological lesions of ankle joints of treated and untreated rats. (a) H&E staining of ankle joints of CIA rats treated with various extracts. Blue arrow, joint-space; brown arrow with black border, inflammatory cell infiltration; black arrow, synovial hyperplasia; yellow arrow, pannus. (b) Pathological scores of synovitis, pannus formation, degradation of cartilage, and bone were evaluated blindly. ∗p < 0.05 and ∗∗p < 0.01 compared with CIA group.

