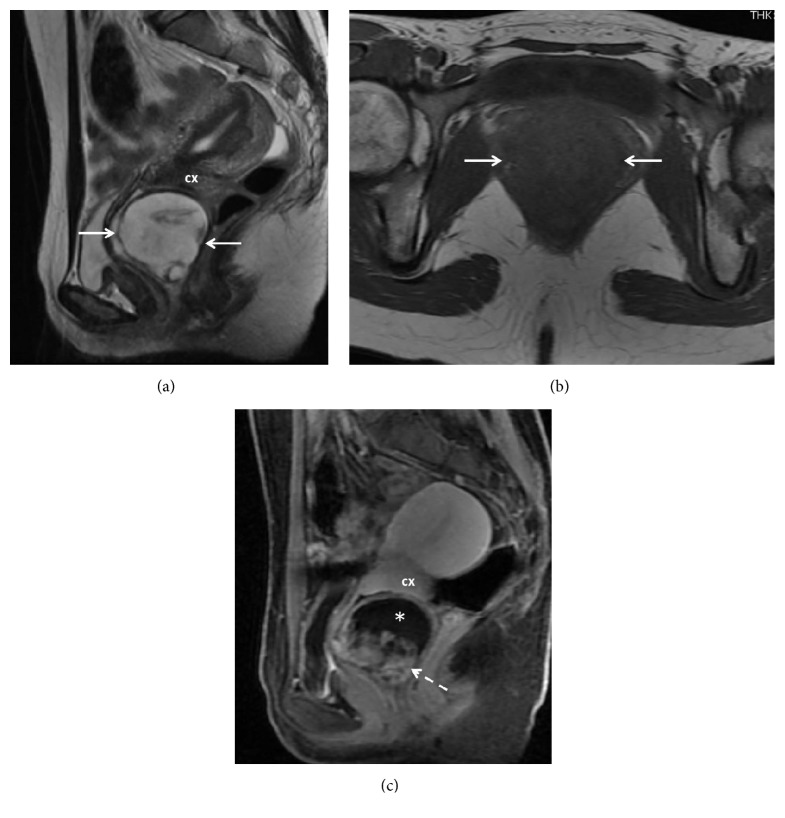
Figure 3.
(a) Sagittal T2 weighted image shows a predominantly hyperintense mass (arrows) with small central areas of hypointensity. (b) On T1 weighted axial image the mass is homogeneously hypointense (arrows). (c) Sagittal contrast enhanced image demonstrates heterogeneous hyperenhancement inferiorly (dashed arrow) and absent enhancement superiorly (∗). Cervix: cx.

