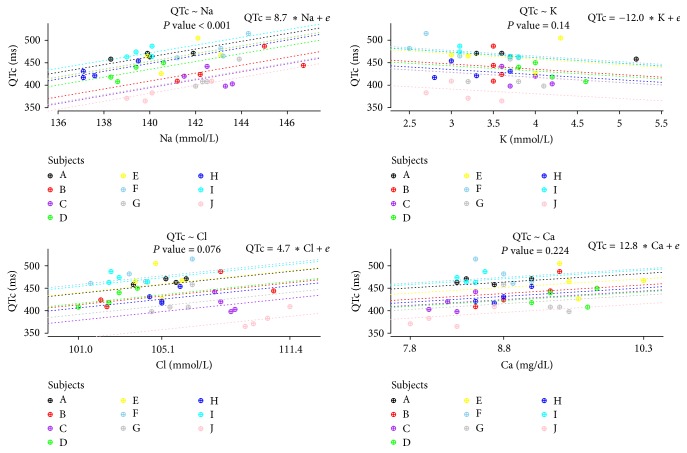
Figure 5.
The associations between QTc intervals and the changes of serum electrolytes levels. P value was attained by likelihood ratio tests. The letters A–J indicate individual subjects, and symbols in the plots, which have the same color matched with the letters, denote repeated measurements within an individual. Dotted lines indicate linear regression equations from a linear mixed model with random intercepts or slopes for the by-subject.

